
XLM Price Analysis – January 23
After the last few days of upward movement, the bulls are suffering from a slight downtrend playing on the daily chart.
XLM/USD Market
Key Levels:
Resistance levels: $0.068, $0.070, $0.072
Support levels: $0.051, $0.049, $0.047
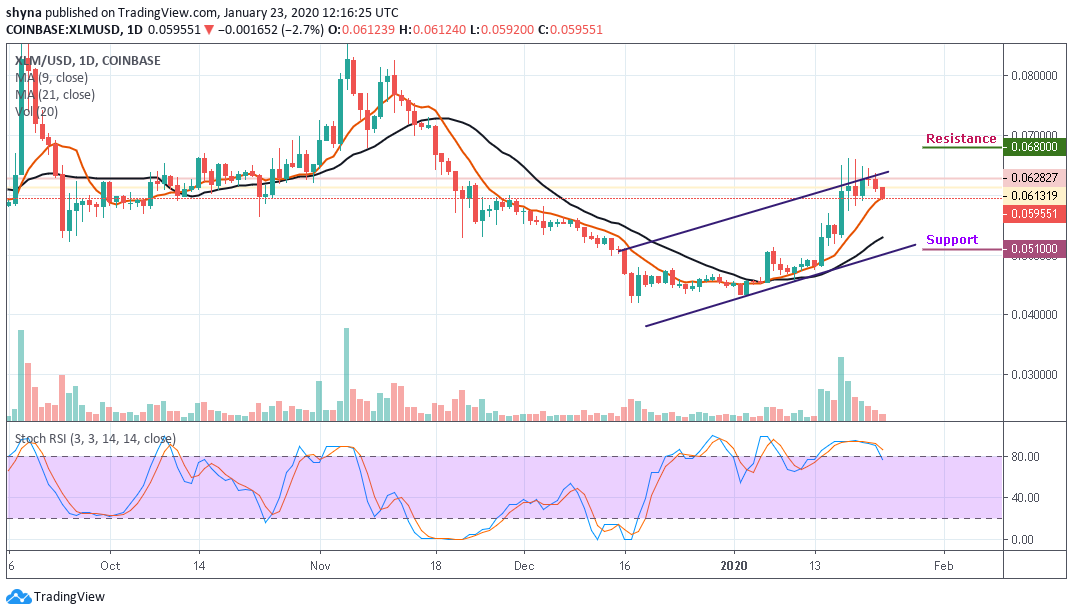
At the time of writing, XLM/USD is changing hands around 9-day moving average at $0.059 level, the coin has been moving in sync with the broader market gripped by bearish sentiments and panic selling. Stellar is the tenth-largest cryptocurrency with the current market value of $1.21 billion and an average daily trading volume of about $353 million.
However, as the Stellar price remains jerky, we await the possible direction of the coin. For a positive peak, the $0.068, $0.070 and $0.072 are the main resistance levels for the coin at the moment. Looking at the volume of the chart, we can see the XLM at its lowest. As a result, a negative spike would test significant support at $0.051 and $0.049 before a slippage of $0.047.
More so, XLM/USD is bearish in the short run as stochastic RSI is about moving out of the overbought territory, which indicates more bearish signals.
XLM/BTC Market
Comparing with Bitcoin, the pair has eventually broken another solid support at the 710 SAT. Stellar price may likely see another sharp drop at 650 SAT support level. Breaking this level could further drag the market to the nearest support levels at 620 SAT, 600 SAT, and 580 SAT.
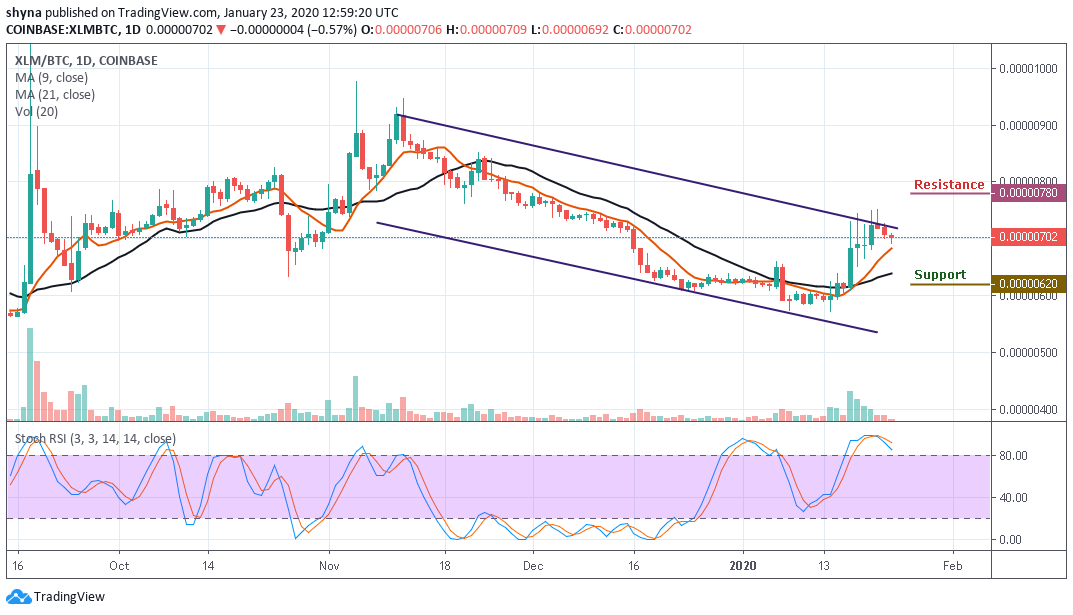
However, XLM is currently changing hands at 702 SAT and if the bulls can hold the price tight and push it above the channel, the next key target price lies at 780 SAT and 800 SAT respectively. Reaching these levels might move it to the 820 SAT level. Meanwhile, the stochastic RSI is now lying at the overbought zone, there might be bearish signals if it turns downward.
Please note: Cryptovibes.com is not a financial advisor. Do your research before investing your funds in any financial asset or presented product or event. We are not responsible for your investing results.