
Disclaimer: The findings of the following analysis attempt to foresee XRP’s price movements over the next 24 hours
XRP’s price action hasn’t been very promising over the past few months. Over a month ago, XRP lost out to Tether in terms of market capitalization, dropping to fourth place on CoinMarketCap’s list. Since the 12 March price crash, XRP hasn’t really bounced back on the charts, with XRP’s trading price, at the time of writing, continuing to struggle when compared to the crypto’s early-2020 valuation.
At press time, XRP was being traded at $0.177 and had a market cap of $7.8 billion. Over the past 24 hours, XRP’s price saw an appreciation of 0.66 percent, having registered a 24-hour trading volume of $976 million.
XRP’s 1-hour chart
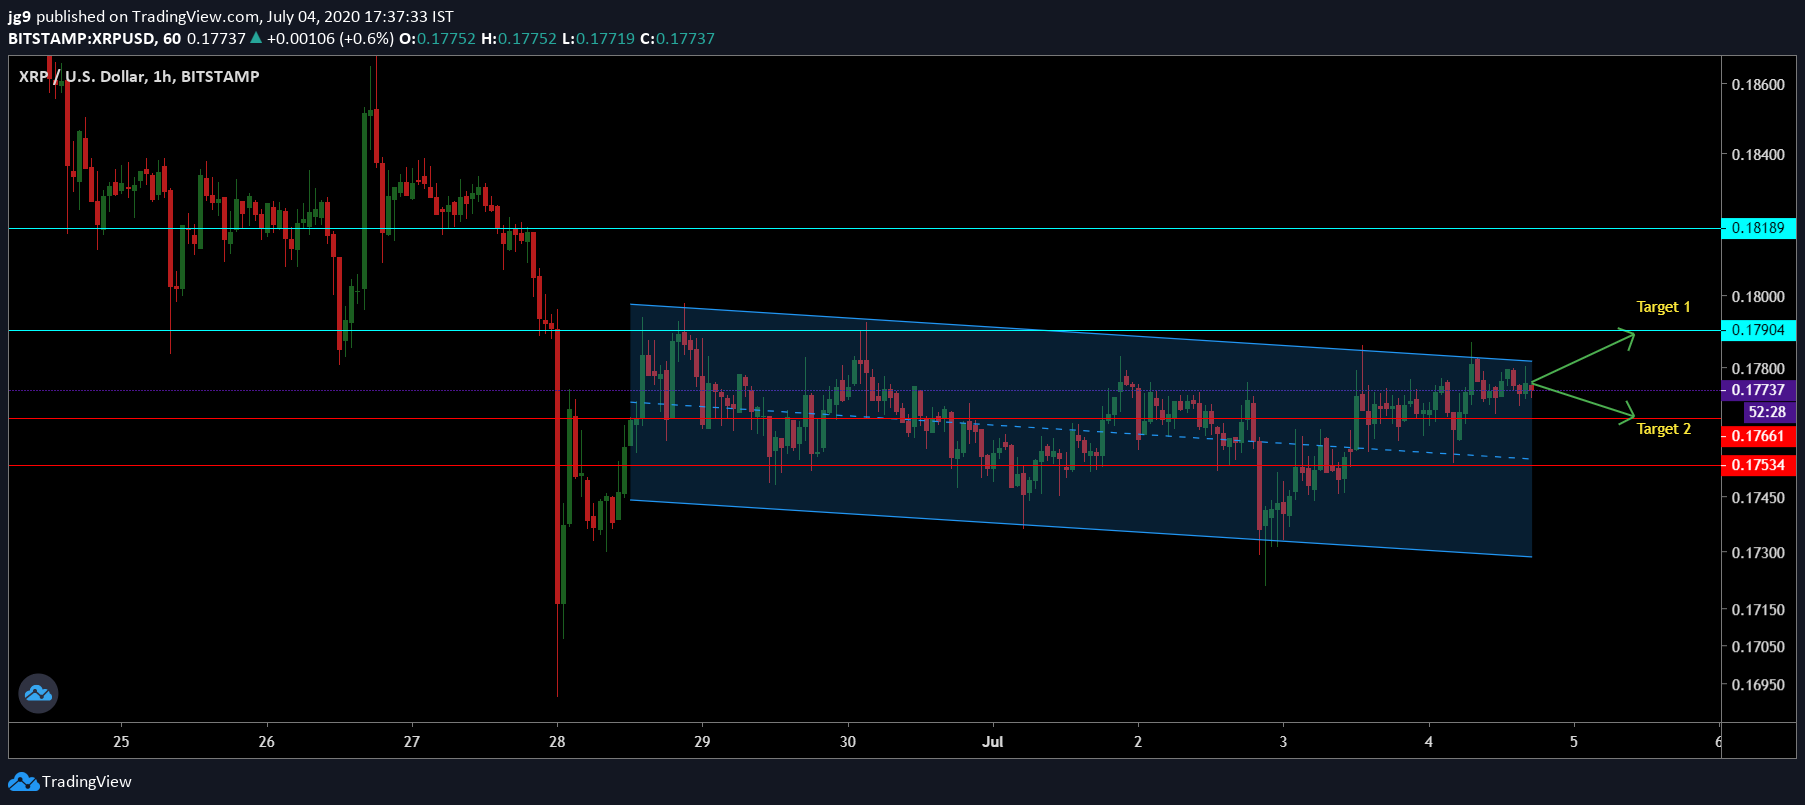
Source: XRP/USD, TradingView
As per the 1-hour chart, XRP’s price has been in a descending channel formation for close to a week now and a price breakout is expected soon. For XRP, if the price were to break out of this formation, the price is well-positioned to register a hike and head towards the resistance at $0.179.
At the time of writing, XRP’s next strong point of resistance was at $0.179. However, the coin had two supports that could come to the aid of the coin at $0.176 and $0.175. Whenever the price does break out of the formation, it is likely to head towards Target 1 at $0.179 in a day’s time. However, if bearish sentiment overwhelms the coin, the coin can retrace to $0.176 – XRP’s immediate support.
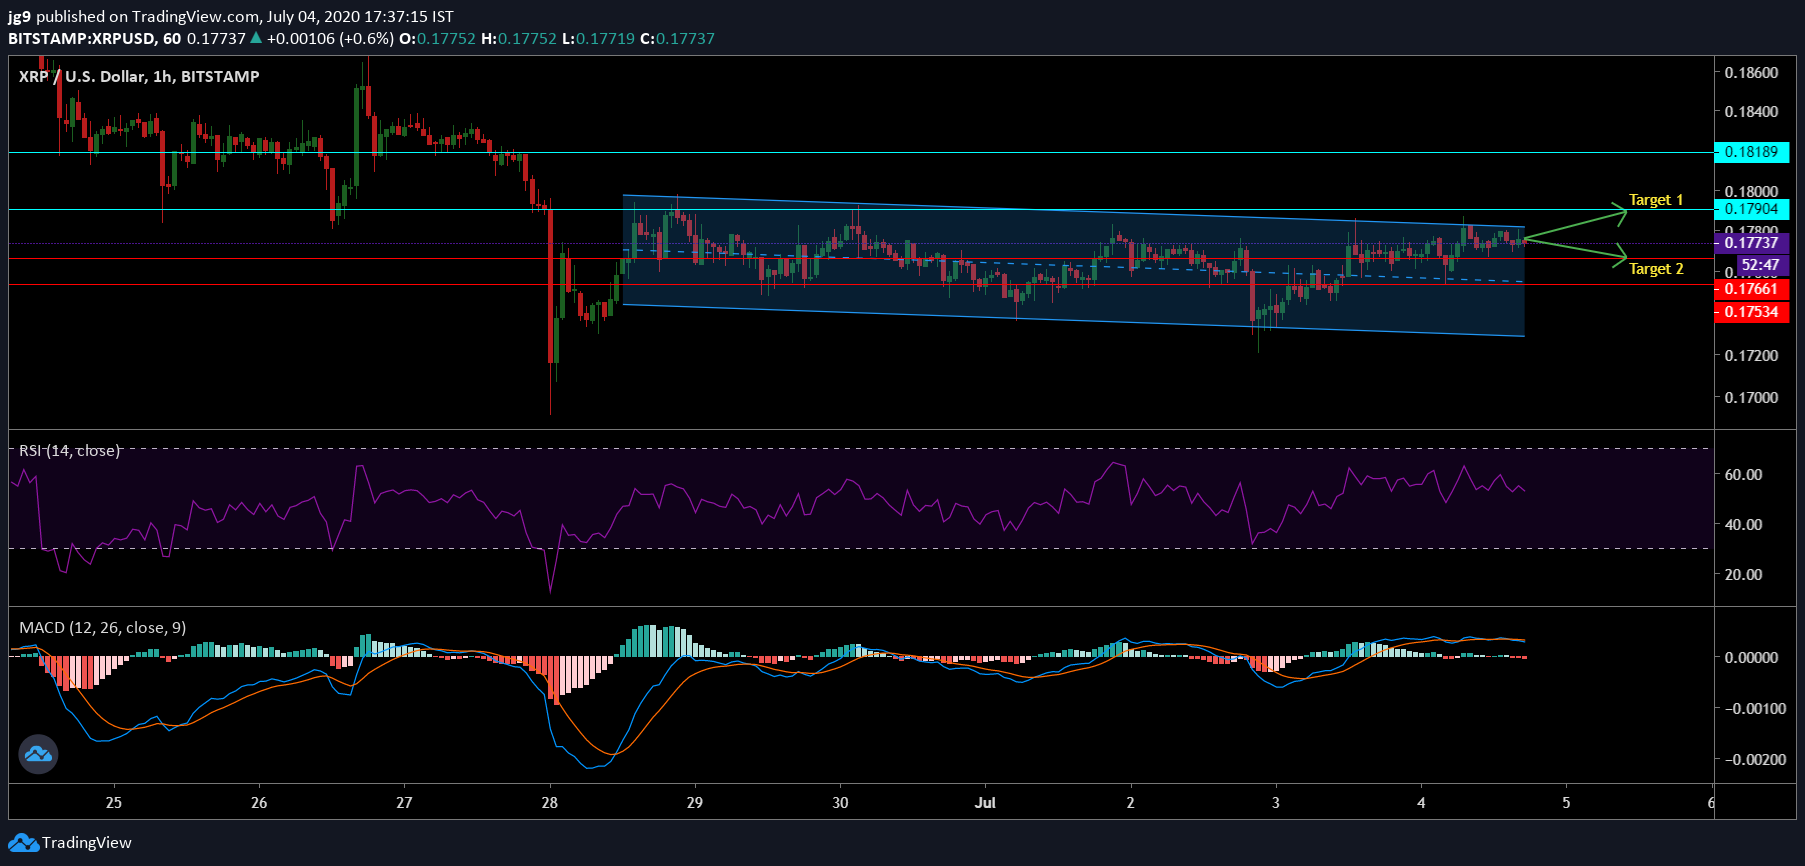
Source: XRP/USD, TradingView
According to hourly charts, the MACD indicator had just undergone a bearish crossover, with the signal line going past the MACD line. However, the RSI indicator, at the time of writing, was inching closer to the overbought zone, signaling strong bullish momentum for XRP.
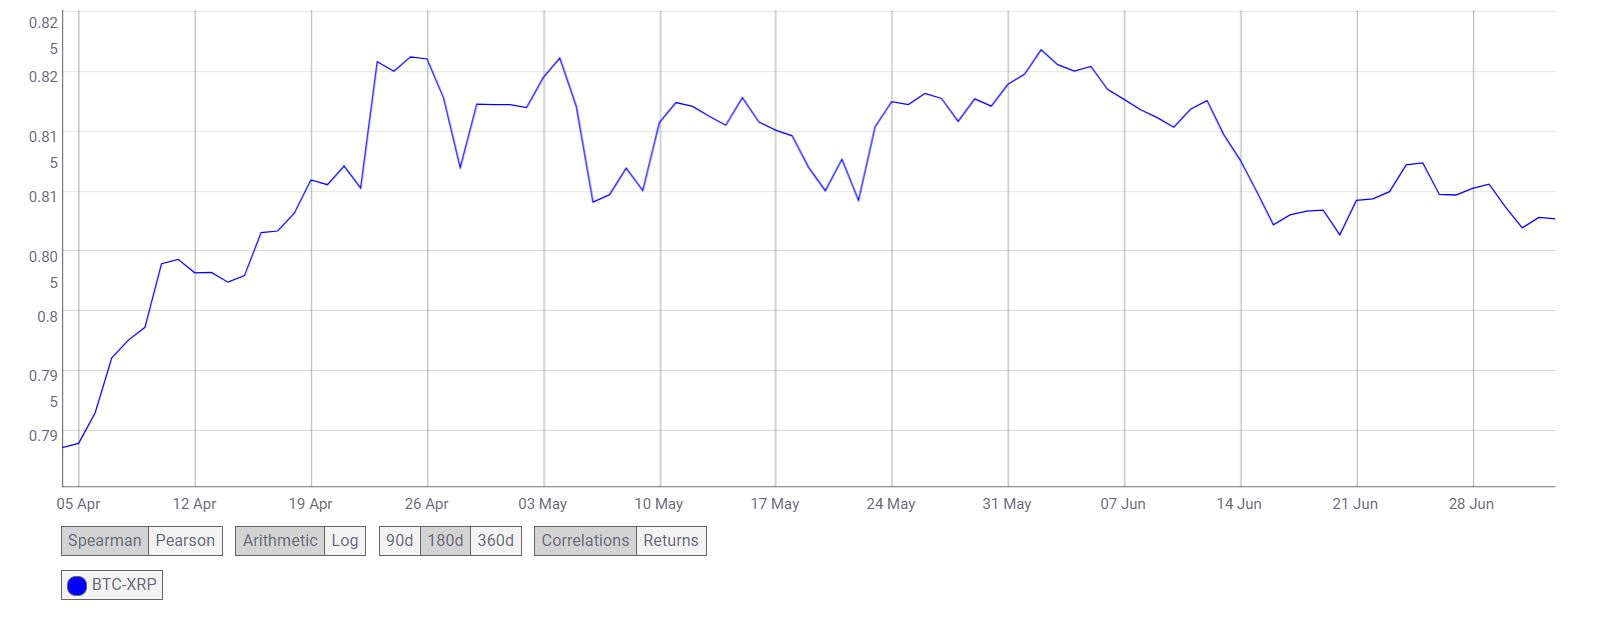
Source: CoinMetrics
Altcoins like XRP normally tend to have a high correlation with the world’s largest cryptocurrency – Bitcoin, and the past 3 months saw the same materialize. Since April, the correlation between BTC and XRP has risen slightly from 0.78 to 0.80, according to CoinMetrics’ chart.
Conclusion
XRP has been in a descending channel for a substantial amount of time and once the price breakout happens, the price is likely to head towards Target 1 at $0.179 in the next 24-hours. However, if XRP were to note another wave of bearish momentum, then the price retracing to the immediate support at $0.176 is highly possible.
Your feedback is important to us!