Review findings and study characteristics
A total of 3,189 studies were generated by the search strategy, of which 40 met the eligibility criteria (S1 Fig). We carried out a one-stage IPD analysis that included 14 studies whose authors responded within the timeframe of our study, of which 11 were identified in the review and 3 through contacting authors. The studies were set in Benin, Malaysia, Mozambique, Tanzania, The Gambia, Uganda, the UK, Yemen, and Zambia. Data from a total of 3,989 patients with SM and 5,780 UM cases were included in the pooled analysis (Table 1, S2 Table). For 4 of the studies with a case–control design, controls (UM) and cases (SM) were matched on age and sex [21,22,30] (details of study design and matching of included studies shown in S3 Table). The quality of all studies included was ranked as ‘Good’, with all studies scoring 7 or more out of 10 on the NOS scale (S2 Checklist).
Table 1. Characteristics of studies used in IPD meta-analysis.
Table includes study site, study period, age ranges included, and frequencies and percentages of uncomplicated and SM groups amongst the study sample. Percentages with a given phenotype amongst severe cases are shown in brackets and omit missing values for that phenotype. The denominator only includes those who were assessed for that phenotype. ‘NA’ entries indicate that information on the phenotype in that study was not collected (for example, data on RDS were not collected in the Zambian study). Percentages may add up to more than 100% because the same study subject may present with more than 1 phenotype. This table excludes 196 individuals (2% of total participants) who were classified as severe in the original studies but did not meet the criteria for severe disease in the IPD analysis. See S2 Table for other severe disease phenotypes. See S4 Table for SM frequencies from the UK study, which was not used in the pooled analysis. Abbreviations: CM, cerebral malaria; IPD, individual-participant data; RDS, respiratory distress syndrome; SM, severe malaria SMA, severe malarial anaemia; UM, uncomplicated malaria.
Children aged under 15 constituted 79.6% (N = 4,596) of uncomplicated cases and 94.1% (N = 3,754) of severe cases (S5 Table). The most common severe disease manifestations were prostration (53.1%), SMA (51.0%), hyperlactataemia/acidosis (36.1%), RDS (27.1%), and CM (20.5%) (Fig 1). RDS was relatively common in those with hyperlactataemia/acidosis (phi coefficient = 0.24; see S6 Table for all associations). The distribution of severe disease symptoms varied between study sites (S2 Fig) and by age (Fig 1). In areas of moderate-to-high transmission intensity, such as in Farafenni in The Gambia (2002) and certain areas in Tanzania, most cases were younger children and SMA and prostration were the most common severe disease types, as expected. Jaundice was only common in low-transmission settings and in older populations, such as in Malaysia. In endemic settings, renal impairment was only seen in 0.8% (3/395) of severe cases who were assessed for creatinine or blood urea levels. This was not the case in the UK study population, in which most (43.8%, 74/169) individuals presented with renal impairment and a small number presented with SMA (2.4%, 4/168).
Fig 1. Prevalence of SM phenotypes amongst severe cases by age group.
Proportions were calculated for severe cases with no missing values for a given measure. Information for all phenotypes was not available in all studies (Table 1, S2 and S4 Tables). Each case can present with more than 1 phenotype. SM, severe malaria.
Data on time since first fever or any symptoms prior to arrival at the study health facility, as reported by the patient or caregiver, were available for a total of 7,512 individuals (3,577 UM and 3,935 SM; distribution shown in S3 Fig, S4 Fig, and Fig 2). Reported duration of illness varied by study and age group from a median of 1 to 5 days (S4 Fig and S5 Fig). Data on duration of severe symptoms were also obtained from 5 studies, including information on duration of coma, unconsciousness, convulsions, respiratory distress, fast breathing, or difficulty in breathing (N = 1,323). Care was sought within the first day of severe symptom onset for most cases because the median delay was <1 day after onset of any severe symptom (S7 Table). However, onset of fever or other symptoms of uncomplicated illness for those who later developed SM occurred, on average, between 1 to 3 days before they developed signs of severe disease, depending on the symptoms (S7 Table).
Fig 2. Illness duration (in days) prior to arrival at the health facility by SM phenotype and age group.
Box-and-whisker plots showing median and IQR of duration of illness/fever in children and adults stratified by severity group (ages <15 years: NUM = 3,277, NSM = 3,708; ages ≥15 years: NUM = 300, NSM = 226). Outliers (observations that are 1.5 × IQR from the lower or upper quartiles) are denoted. Extreme outliers, defined as duration of illness of over 3 weeks, are omitted from these plots (0.6% of cases [20 UM and 25 SM] were omitted). SM, severe malaria; UM, uncomplicated malaria.
Association of delay to treatment with severe malarial disease
In children, the adjusted odds of any type of severe disease were significantly higher in patients with longer delays between initial symptoms and arrival at the study health facility after accounting for age and random study effects (OR [95% CI] = 1.33 [1.07–1.64] for a delay of over 24 hours compared with treatment within 1 day in children <15, p = 0.009; Fig 3). When stratifying by different severe disease manifestations, reported duration of illness was a strong predictor of presenting with SMA in children under 15 years (Fig 3; see S8 Table for RRs). Compared with receiving treatment within 24 hours of symptom onset, the OR for presenting with SMA was 2.79 (95% CI: 1.92–4.06, p < 0.001) for a delay between 2 to 3 days and 5.46 (95% CI: 3.49–8.53, p < 0.001) for a delay of over 7 days (χ2(7) = 145.38, p < 0.001). The ORs for presenting with SMA in the subset analysis including only children aged between 6 months and 5 years were slightly higher (delay of 2 to 3 days: OR = 3.18 [95% CI: 2.12–4.79, p < 0.001]; delay of over 7 days: OR = 6.18 [95% CI: 3.80–10.05, p < 0.001]; χ2(7) = 133.14, p < 0.001; S6 Fig). For the same delay groups, the equivalent reduction in haemoglobin levels in children under 15 years, irrespective of severity group, was 1.46 g/dl (95% CI: 1.19–1.73, p < 0.001) and 2.13 g/dl (95% CI: 1.73–2.53, p < 0.001), respectively (χ2(7) = 361.16, p < 0.001; Fig 4). Similar trends were observed for the odds of receiving a blood transfusion with increasing delay to treatment in children <15 years (χ2(7) = 120.95, p < 0.001; Fig 3) or young children <5 years (χ2(7) = 109.96, p < 0.001; S6 Fig). Compared with those arriving within the first day of symptoms, the odds of receiving a blood transfusion when arriving at the hospital 4 to 5 days after symptom onset were 5.06 (95% CI: 3.11–8.22, p < 0.001) times higher in children under 15 years and 4.77 (95% CI: 2.87–7.95, p < 0.001) times higher in children under 5 years. For ages 15 or over, the odds of SMA were only associated with delays of over 4 days (χ2(4) = 22.57, p < 0.001; S7 Fig). If the associations between delay and odds of SMA were entirely causal, we estimate that treating everyone in the study populations within 24 hours after symptom onset would have averted 42.8% of SMA cases in children under 15, 46.8% of SMA cases in children under 5, and 48.5% in adults aged 15 or over. In the UK study of imported adult cases, similar results were observed to those in adults from the pooled analysis (S7 Fig), with the odds of any severe disease being 3–4 times higher in those with a delay of 5 to 7 days compared with those being admitted in the first 24 hours after symptom onset (χ2(7) = 17.59, p = 0.014). In this study, case numbers of individual phenotypes were too small to separate out.
Fig 3.
Treatment delay and odds of presenting with any SM (A), SMA (B), and receiving blood transfusion (C) in children under 15. ORs (and 95% CIs) for presentation with severe disease rather than UM (A & B) with each additional reported day of delay after initial symptoms, compared with patients receiving treatment within 1 day of symptom onset (NUM = 3,277, NSM = 3,708, NSMA = 1,774). Amongst 5 studies with information on blood transfusions during hospital admission, 27.7% (1,520/5,496) of children aged under 15 with available data had received a blood transfusion. ORs (and 95% CIs) for receiving a blood transfusion was estimated for each additional day of illness duration amongst all uncomplicated and severe cases. All ORs shown were obtained from a mixed-effects logistic regression adjusted for age as a linear predictor and allowed for random study effects. Statistically significant ORs are denoted in red (dashed purple line: OR = 1). OR, odds ratio; SM, severe malaria; SMA, severe malarial anaemia; UM, uncomplicated malaria.
Fig 4.
Treatment delay and change in Hb levels for (A) children aged under 15 and (B) adults aged 15 years and over. The change in Hb in g/dl for each extra day of delay compared with Hb in those treated within 24 hours. An increase in delay was associated with decrease in Hb levels (children: likelihood ratio χ2(7) = 361.16, p < 0.001; adults: likelihood ratio χ2(7) = 41.62, p < 0.001). Hb was recorded for 5,908 individuals in 10 of the studies, and its concentration was normally distributed. A mixed-effects general linear model was used to examine the relationship between delay and Hb levels, irrespective of severity group. On average, children who were admitted to the hospital more than 3 days after symptom onset had a reduction in Hb of at least 2 g/dl compared with those receiving treatment in the first day after illness onset. Hb, haemoglobin.
In the overall data set, no relationship was observed between duration of illness and presentation with any other SM phenotypes for either children or adults (Fig 5, S7 and S8 Figs). However, caregivers may have reported the time of onset of severe symptoms if asked about duration of illness rather than initial onset of UM symptoms. We therefore also repeated the analysis restricted to a subset of 9 studies that specifically recorded onset of fever, the most common UM symptom (N = 1,866, including 1,689 children aged under 15 years). In these studies, there was some evidence of an association between treatment delay after fever onset and all severe phenotypes except hyperparasitaemia (Fig 5, S9 Fig). Compared to receiving treatment within 24 hours of fever onset, the OR for a child presenting with CM and RDS for a delay of 3 to 4 days after fever onset was 2.42 (95% CI: 1.24–4.72; p = 0.01) and 4.09 (95% CI: 1.70–9.82; p = 0.002), respectively. A delay of over 4 days from fever onset was not associated with the odds of presenting with CM (>4 to ≤5 days: OR = 1.43 [95% CI: 0.56–3.63, p = 0.45], 5+ days: OR = 1.00 [95% CI: 0.50–2.12, p = 1.00] compared with a delay of ≤24 hours; Fig 5).
Fig 5.
Treatment delay and odds of presenting with CM (A–B) and respiratory distress (C–D) in children <15 years. ORs (and 95% CIs) for presentation with severe disease with each additional reported day of illness before attending the health facility compared with patients attending within 1 day of reported illness onset (A and C; NUM = 3,277, NCM = 737, NRDS = 945) or fever onset (B and D; NUM = 492, NCM = 441, NRDS = 251). ORs were obtained from a mixed-effects logistic regression adjusted for age as a linear predictor and allowed for random study effects. Statistically significant ORs are denoted in red (dashed purple line: OR = 1). The same plots for other SM phenotypes are shown in S9 Fig. CM, cerebral malaria; OR, odds ratio; RDS, respiratory distress syndrome; SM, severe malaria UM, uncomplicated malaria.
Sensitivity analysis accounting for mother’s educational attainment was carried out. Low mother’s education was significantly associated with SMA, RDS, and CM (OR range = 1.74–1.81) but did not affect the relationship between treatment delay and disease severity (S9 Table). To explore the influence of overlapping severe symptoms, we repeated the analysis excluding individuals with more than 1 type of symptom. The association between delay and severe disease phenotypes in the absence of other severe phenotypes remained similar as in the main analysis (S9 Table). The mean number of severe phenotypes at presentation did not increase with increasing duration of illness (χ2(7) = 2.67, p = 0.92).
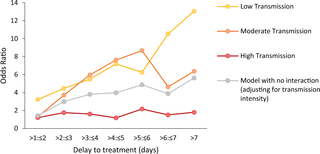
There is some evidence to suggest that the association between treatment delay and severity is stronger in areas with low malaria transmission compared to areas with high malaria transmission. There was no interaction between transmission intensity and treatment delay on the odds of CM and there was a nonlinear association with odds of RDS (likelihood ratio tests: CM: χ2 = 18.99, p = 0.17; RDS: χ2 = 48.92, p < 0.001; Fig 6, S10 Table). An almost-linear increase in the effect size of treatment delay on SMA with a decrease in transmission intensity was observed (likelihood ratio test: χ2 = 49.86, p < 0.001; Fig 6, S10 Table). Compared with receiving treatment within the first day the OR for presenting SMA for a delay of 4 to 5 days was 7.19 (95% CI: 2.38–21.73; p < 0.001) in those living in areas of low transmission (<10% PfPR2–10). In areas of high malaria transmission intensity (≥35% PfPR2–10), the equivalent OR was smaller and not statistically significant (OR = 1.18, 95% CI: 0.10–13.68). Nonetheless, the proportion of SMA amongst severe cases was much higher in high malaria transmission settings compared with low and moderate transmission intensities (<10% PfPR2–10 = 0.39; 10% to <35% PfPR2–10 = 0.51; ≥35% PfPR2–10 = 0.77). Mean haemoglobin, even in children with UM, was much lower in areas with high malaria transmission intensity (6.41 g/dl, 95% CI: 6.31–6.51 for ≥35% PfPR2–10) compared with areas of lower malaria transmission intensity (9.78 g/dl, 95%CI: 9.54–10.01 for <10% PfPR2–10; p < 0.001), suggesting there might be higher levels of pre-existing anaemia in these populations.
Fig 6. Association between delay to treatment and SMA for different levels of transmission intensity in children <15 years.
ORs for the association between duration of illness and SMA from 2 age-adjusted mixed-effects models: one adjusting for transmission intensity level and one accounting for an interaction between transmission intensity and delay. Transmission intensity was categorised into low (PfPR2–10 < 10%), moderate (PfPR2–10 10% to <35%), and high (PfPR2–10 ≥ 35%). CIs around the OR estimates are shown in S10 Table. OR, odds ratio; SMA, severe malarial anaemia.
Mortality outcomes during admission were available for 2,921 UM and 3,811 SM cases. Mortality was 1.0% in the uncomplicated group and 8.3% in the severe group (S11 Table). The highest case fatality rate was observed for CM (19.6%). Although mortality was dependent on the type of severe disease (S10 Fig), it was not associated with duration of illness in severe cases when adjusting for age (p > 0.05 for any day of delay for both children and adults). Mortality was higher in children with SMA compared to the uncomplicated group accounting for age (OR = 7.27, 95% CI = 4.57–11.56, p < 0.001), even with exclusion of SMA cases who also presented with other severe phenotypes (OR = 1.95, 95% CI = 1.07–3.55, p = 0.03). Amongst children with severe disease, mortality in SMA cases was lower compared with those with other severe phenotypes, adjusting for age (OR = 0.63, 95% CI = 0.49–0.82, p = 0.001). A lower proportion of individuals presenting with SMA were febrile (>37.5°C) at presentation compared with other phenotypes (56.4% febrile for SMA compared with a range of 61.1%–84.0% febrile for other phenotypes). Amongst SMA cases, a higher proportion seeking treatment quickly (within 1 day of symptom onset) had fever at presentation (63.8% versus 56.3% presenting to the hospital after the first day of symptom onset), suggesting that fever may trigger treatment-seeking more than other SMA symptoms.
Travelling time to the health facility was recorded for 2,604 UM cases and 2,579 SM cases and was strongly associated with increased odds of severe disease, though the association between geographic distance and severity was not as strong (S11 Fig and S12 Fig). A small but statistically significant positive correlation was found between duration of illness and travelling time (Spearman’s rho = 0.16, p < 0.001, N = 5,313). The odds of severe disease were approximately 2–3 times higher for those living further than 1 hour of travel time from the health facility, even after adjusting for duration of illness (S11 Fig). This suggested a selection bias, with cases living further away being less likely to travel to the health facility when the illness was not severe. The association between delay to treatment and SMA remained similar after adjustment for travelling time to the health facility (OR of SMA = 3.12 for a delay of 2 to 3 days versus ≤24 hours, 95% CI: 1.78–5.48 [p < 0.001]; not adjusted for travelling time for the same subset: OR = 3.36, 95% CI: 1.92–5.87 [p < 0.001], S13 Fig). The same conclusions were drawn when restricting the analysis to children living close to the health facility (distance < 17.2 km or travelling time <35 minutes; S13 Fig; for a delay of 2 to 3 days compared with ≤ 24 hours: OR = 3.30, 95% CI = 1.37–7.97, p = 0.008). Assuming that treatment is received within 24 hours, the reduction of SMA cases estimated from this subgroup analysis is 63.3% for children and 57.9% for adults.
Geolocated individual-level data were available for a subset of the individuals from the Tanzanian study conducted in 2002 (n = 3,992) [13]. Amongst children with available data on illness duration, 13% (219/1,706) were classified as living in an urban location. Residing in an urban location was associated with lower odds of SM compared with living in a rural location in this setting (any SM: OR = 0.39, 95% CI = 0.32–0.48, p < 0.001; SMA: OR = 0.18, 95% CI = 0.12–0.25, p < 0.001). In the stratified analysis of this subset population, the OR comparing ≤24 hours versus >24 hours for any SM was 0.94 (95% CI = 0.49–1.80, p = 0.84) for those living in rural areas and 1.02 (95% CI = 0.30, 3.50; p = 0.97) in urban areas, but this difference was not statistically significant (interaction term: p = 0.86). A test for this interaction for specific SM phenotypes could not be performed because of the small sample size with severe disease living in urban areas. The mean population density around a 30-km radius of a hospital’s location ranged between 18 per km2 (Macha, Zambia) and 1,562 per km2 (Cotonou, Benin). For children admitted to hospitals located in areas of low population density (≤300/km2), the OR for a delay of >24 hours compared to being admitted within the first day of symptom onset was 1.43 (95% CI = 1.11–1.84, p = 0.005) for any SM and 2.52 (95% CI = 1.75–3.64; p < 0.001) for SMA. In more densely populated areas (>300/km2), the equivalent ORs for SM and SMA were 1.08 (95% CI = 0.72–1.61; p = 0.72) and 4.59 (95% CI = 1.12–18.75; p = 0.03), respectively. The association between duration of illness and severity was not significantly different between the 2 population density groups (test for an interaction—SM: p = 0.32; SMA: p = 0.35).
Prior treatment with any antimalarial outside the hospital setting was much more common for severe cases (65.8%; 2,059/3,127) than uncomplicated cases (24.8%; 1,037/4,183). In children, prior treatment was associated with longer delay to admission (χ2 = 115.71, p < 0.001). Those who lived over 10 km from a health facility were more likely to have taken antimalarial treatment compared with those living within 10 km (OR [95% CI] = 2.65 [1.56, 4.50]; χ2 = 15.12, p = 0.001). Compared with receiving no prior treatment and adjusting for delay to treatment, an association of prior treatment was observed with presentation with severe disease in children (OR = 1.50, 95% CI: 1.22–1.85, p = 0.028), but this was not the case when also accounting for travelling time (OR = 1.14, 95% CI: 0.82–1.59, p = 0.45). However, an association was observed between prior antimalarial treatment and increased odds of SMA, even when accounting for both illness duration and travelling time (OR = 1.55, 95% CI: 1.03–2.33, p = 0.035), though it was unknown whether reported antimalarial use occurred before onset of severe symptoms. Prior treatment with ACT specifically was not associated with a change in the odds of any SM (OR = 0.55, 95% CI: 0.22, 1.36; p = 0.19), adjusting for treatment delay. In the subset analysis including patients who reported taking no antimalarial treatment prior to admission, similar relationships were observed between treatment delay and severity (S14 Fig). In this analysis, we estimate that 29.7% of SMA cases in children would have been averted if they received treatment within the first 24 hours of symptom onset. We further investigated the association between severity and first-line antimalarial treatment policies of each country. The studies conducted in Zambia, The Gambia (Farafenni), Yemen, Tanzania (2002), and Uganda (2003) were classified as pre-ACT. We found no significant interaction between duration of illness and classification of study as pre- or post-ACT policy (likelihood ratio test for presence of an interaction: p = 0.24 and p = 0.78 for any SM and SMA, respectively).
