Clinical Samples and Ethics Statement
Clinical samples of COVID‐19 used in this study were collected and treated in strict accordance with the standard operation of WHO and were approved by the Scientific Research Ethics Review Committee of the First Affiliated Hospital of Guangzhou Medical University. Informed consent was obtained from the patients or
from the patients’ legal representatives. Nasopharyngeal swab samples were collected from patients at admission, and RNA was extracted from the samples using the QIAamp RNA Viral Kit (Qiagen, Heiden, Germany). The MERS‐CoV RNA sample was extracted from China GD01 strain (GenBank Accession No. KT006149) from the Guangzhou Institute of Respiratory Health.[25] All virus samples were inactivated in a BSL‐3 laboratory, and viral RNA was prepared in a BLS‐2 laboratory.
Expression and Purification of Recombinant Cas12a Proteins
LbCas12a was expressed and purified as previously described.[11] In brief, the coding sequences of LbCas12a were codon‐optimized and synthesized by Genscript (Nanjing, China) and then cloned into pET28a (Novagen) with a C‐terminal 10× His tag. The coding sequence of AsCas12 was synthesized by Genscript (Nanjing, China) as previously described.[26] The pET28a–Cas12a plasmid was transformed into Escherichia coli BL21 (DE3) and induced with 0.2 × 10⁻³ m Isopropyl ß‐D‐1‐thiogalactopyranoside (IPTG) for 16 h at 18 °C before the cell harvesting. After cell pellets lysis, the Cas12a protein was purified using a Ni–NTA (Nickel‐nitrilotracetic acid) resin column and heparin sepharose column according to the manufacturer’s instructions (G.E. Healthcare). Then the purified Cas12a protein was concentrated into storage buffer (50 × 10−3 m Tris‐HCl, pH 7.5, 500 × 10−3 m NaCl, 10% (v/v) glycerol, 2 × 10⁻³ m dithiothreitol), quantitated using the BCA Protein Assay Kit (Thermo Fisher Scientific, MA, USA), and frozen at −80 °C until use.
Nucleic acid Preparation
The E gene fragment of SARS‐CoV‐2 (Wuhan‐1 strain, GenBank: MN908947), E gene fragment form MERS‐CoV (England‐1 strain, GeneBank: KC164505) were synthesized by GenScript (Nanjing, China) and cloned into the pUC57 vector with a T7 primer. The crRNAs were synthesized by GenScript (Nanjing, China), and sequences are listed in Table S1 (Supporting Information).
The RNA fragments of the target gene were cloned with thein vitro transcription (IVT) primers and transcribed using the MEGAshortscript T7 Transcription Kit (Thermo Fisher Scientific, MA, USA). Then RNAs were purified with the MEGAclear Kit (Thermo Fisher Scientific, MA, USA) and recovered by alcohol precipitation according to the manufacturer’s instructions. RNAs were aliquot and stored at −80 °C till used. The primers used for in vitro transcription are listed in Table S2 (Supporting Information).
To address the potential off‐target issue and cross reaction with the human genome, three human cell lines (HEK293, Hela, and A549 cell) were used as the source of human genome. HEK293 and Hela cells were maintained in high‐glucose Dulbecco’s modified Eagle’s medium (DMEM; Hyclone, SH30243), supplemented with 10% heat‐inactivated fetal bovine serum (FBS; Gibco, 10099141). A549 cells were maintained in F‐12K medium (Hyclone, SH30526) and supplemented with 10% heat‐inactivated FBS. The cells were cultured at 37 °C in an incubator with 5% CO2. Total cell RNA was extracted from the cultured cells using total RNA extraction reagent (Vazyme, R401‐01), following the manufacturer’s instructions. Briefly, 1 × 10⁷ cells were lysed in 1 mL RNA extraction agent. Total RNA was extracted by chloroform and mixing thoroughly. After centrifuging at 12 000 × g for 15 min, the supernatant was mixed with an equal volume of isopropanol and centrifuged at 12 000 × g for 10 min. After washing with 75% ethanol, the RNA pellet was dissolved in RNase‐free water and stored at −80 °C.
Saliva RNA was extracted from the saliva sample using QIAzol Lysis Reagent (QIAGEN, 79306) following the manufacturer’s instructions. Briefly, 1 mL of saliva sample was centrifuged at 13 000 × g for 15 min at 4 °C, and the pellet was lysed by 1 mL of QIAzol. Saliva RNA was extracted by chloroform for two times. The chloroform was mixed with chilled isopropanol and centrifuged at 13 000 × g for 20 min. After washing with 75% ethanol, the RNA pellet was dissolved in RNase‐free water and stored at −80 °C. Saliva DNA was extracted from the saliva sample using saliva gDNA Isolation Kit (Thermo Fisher, A39059) following the manufacturer’s instructions. In brief, the saliva sample was mixed with DNA Lysis/Binding Bead. Next, shaking at 800 rpm for 5 min, the supernatant was discarded. After washing three times, the DNA was eluted in the elution buffer.
Cas12a‐Mediated Nucleic Acid Detection
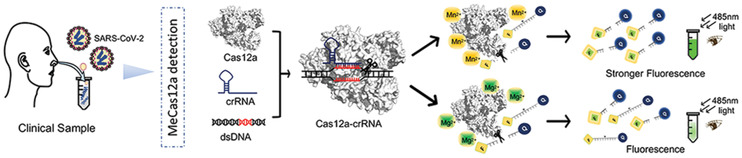
The detection assays were performed as previously reported with minor modifications.[11] In a 20 µL detection assay, with 200 ng LbCas12a protein, 25 × 10−12 m ssDNA FQ probe sensor, 1 × 10⁻⁶ m crRNA, and 2 µL of the sample in a reaction buffer (100 × 10−3 m NaCl, 50 × 10−3 m Tris‐HCl, 100 µg mL−1 BSA(bovine serum albumin), pH 7.9) supplied with 10 × 10−3 m MgCl2 or MnSO4, were incubated at 37 °C until detection. A PerkinElmer EnSpire reader with the excitation at 485 nm and emission at 520 nm was used for fluorescence detection. The naked‐eye determination was taken under 485 nm light and photographed with a mobile phone. For the divalent‐ion preference screen, the detection assay was supplemented with 10 × 10−3 m EDTA (Ethylenediaminetetraacetic acid), EGTA (Ethylene glycol tetraacetic acid), CaCl2, CoCl2, CuSO4, FeSO4, NiSO4, MgSO4, MnSO4, or ZnSO4.
For Michaelis–Menten analysis, Cas12a–crRNA–activator (target dsDNA) complexes were prepared as described above, and reaction was initiated by diluting Cas12a complexes to a final concentration of 32 × 10−9 m LbCas12a:50 × 10−9 m SC2‐crRNA:0.16 × 10⁻⁹ m DNA activator (effective complex = 0.16 × 10⁻⁹ m, SARS‐CoV‐2 E gene) in a solution containing 1× reaction buffer and 0.38 × 10⁻⁶, 0.75 × 10⁻⁶, 1.5 × 10⁻⁶, 2.3 × 10⁻⁶, and 3 × 10⁻⁶ m of fluorescence‐quenched ssDNA substrate (GenScript, China). Reactions were incubated in a fluorescence plate reader for up to 30 min at 37 °C with fluorescence measurements being taken at every 60 s (λex: 485 nm; λem: 520 nm). The initial velocity (V0) was calculated by fitting to linear regression and plotted against the substrate concentration to determine the Michaelis–Menten constants (GraphPad Software), according to the following equation: Y = (Vmax × X)/(Km + X), where X is the substrate concentration and Y is the enzyme velocity. The turnover number (kcat) was determined by the following equation: kcat = Vmax/Et, where Et = 0.16 × 10⁻⁹ m.
Isothermal Amplification Coupled MeCas12a Detection
The RAA or RT‐RAA was introduced for the target gene preamplification by using a commercial RAA kit (Qitian Biological Co., Ltd., Jiangsu, China) according to the manufacturer’s instructions. Briefly, in a 50 µL reaction assembled with 25 µL of reaction buffer, 2 µL of forward primer (10 × 10−6 m), 2 µL of reverse primer (10 × 10−6 m), x µL of the sample, 18.5 − x of RNase‐free double distilled H2O (ddH2O), and 2.5 µL of magnesium acetate (280 × 10−3 m) were mixed gently before incubating at 39 °C for 30 min. Then, the RAA or RT‐RAA products were desalted using the Zeba column (Cat. 89882, Thermo Fisher Scientific). The desalted sample was transferred to the Cas12a‐mediated detection assay system.
qPCR Assay
The TaqMan “real‐time PCR” detection of the SARS‐CoV‐2 E gene was carried out using a Quant Studio 5 system (Applied Biosystems, MA, USA) according to the WHO recommended procedure (https://www.cdc.gov/coronavirus/2019-ncov/lab/rt-pcr-detection-instructions.html) and detected with commercial TaqMan assay kit (Q222‐cn, Vazyme Biotech Co., Ltd., Nanjing, China) according to the manufacturer’s instructions. The amplification primers and probes are shown in Table S2 (Supporting Information). Under the conditions of all positive and negative controls exhibiting the expected performance, the specimen of which amplification plots rise distinctly within the 38.9 cycles (Ct < 40) could be judged to be positive.
Statistical Analysis
All experimental results were shown as mean ± standard error of the mean (SEM) unless stated otherwise. One‐way analysis of variance (ANOVA) was used when comparing more than two groups. When only two groups were compared, statistical significance was assessed with an unpaired Student’s t‐test. Significance was considered as *p < 0.05; **p < 0.01; ***p < 0.001; and ****p < 0.0001. Statistical analyses were carried out with GraphPad Prism 8.0.