Alphabet Inc Daily Price Recap
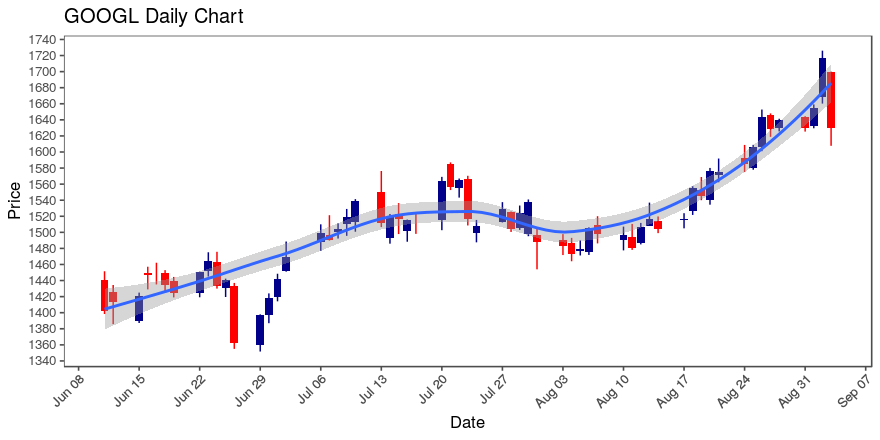
1629.51 was the closing price of the day for Alphabet Inc, resulting in today being one in which price moved down 5.12% ($87.88) from yesterday. The price move occurred on stronger volume; specifically, yesterday’s volume was up 25.84% from the day prior, and up 146.87% from the same day the week before. Here is a daily price chart of Alphabet Inc.

Alphabet Inc Technical Analysis
Trend traders will want to observe that the strongest trend appears on the 14 day horizon; over that time period, price has been moving up. For another vantage point, consider that Alphabet Inc’s price has gone up 6 of the previous 10 trading days. Traders may also wish to note that there is a bearish engulfing pattern in play, which suggests the uptrend on the 14, 30 and 90 day charts, may be slowing down and ready to reverse.
Overheard Around the Web
Here’s what one trader on StockTwits recently had to say in regards to GOOGL:
The chart below highlights how most of the big-tech issues have dropped back into the average range of their prices. The linear regression study shown on each of the four panels, Microsoft ($MSFT), Apple ($AAPL), Tesla ($TSLA) and Alphabet ($GOOGL) displays the statistical upward trend since late April, when volatility began to decrease. This seems to be a reasonable measure of the current trend, and these stocks are staying nicely within the ranges.
The one exception among these stocks is MSFT. Comparatively it looks the weakest. If the rest of the market were to have trouble, it would probably show up in the price pattern of MSFT first. Chart watchers would do well to keep an eye on whether these shares rebound in the lower range of the regression channel or not. $NDX