Accounting for heat burdens
As climate warming becomes more and more apparent and influential, there is an increasing desire to predict its long-term impacts on species. Classically, this has been done by extrapolating lethal limits based on those observed in the laboratory. In the real world, however, organisms do not experience a single high temperature that then returns to a comfortable temperature, but rather a series of high temperatures during the hot season. Rezende et al. accounted for these accumulative effects in a dynamic model that accurately predicted empirical patterns in wild fruit fly populations, showing that cumulative effects of warming temperatures can be included in future estimates (see the Perspective by Huey and Kearney).
Abstract
Average and extreme temperatures will increase in the near future, but how such shifts will affect mortality in natural populations is still unclear. We used a dynamic model to predict mortality under variable temperatures on the basis of heat tolerance laboratory measurements. Theoretical lethal temperatures for 11 Drosophila species under different warming conditions were virtually indistinguishable from empirical results. For Drosophila in the field, daily mortality predicted from ambient temperature records accumulate over weeks or months, consistent with observed seasonal fluctuations and population collapse in nature. Our model quantifies temperature-induced mortality in nature, which is crucial to study the effects of global warming on natural populations, and analyses highlight that critical temperatures are unreliable predictors of mortality.
Global warming is a major threat to biodiversity, with temperature averages and extremes forecasted to change substantially in the next 50 years (1), and predicting which lineages, communities, and geographical regions are more vulnerable constitutes a major challenge (2, 3). Numerous research groups have used critical limits, namely the lower or upper temperatures at which performance drops to zero (4, 5), to unravel broad-scale macroecological patterns such as a higher vulnerability to rising temperatures in terrestrial organisms from the tropics (6, 7). However, the reliability of these proxies is uncertain because different experimental protocols elicit different estimates (8, 9) and values are often unusually high when compared with temperatures encountered in nature [(10), but see (11)].
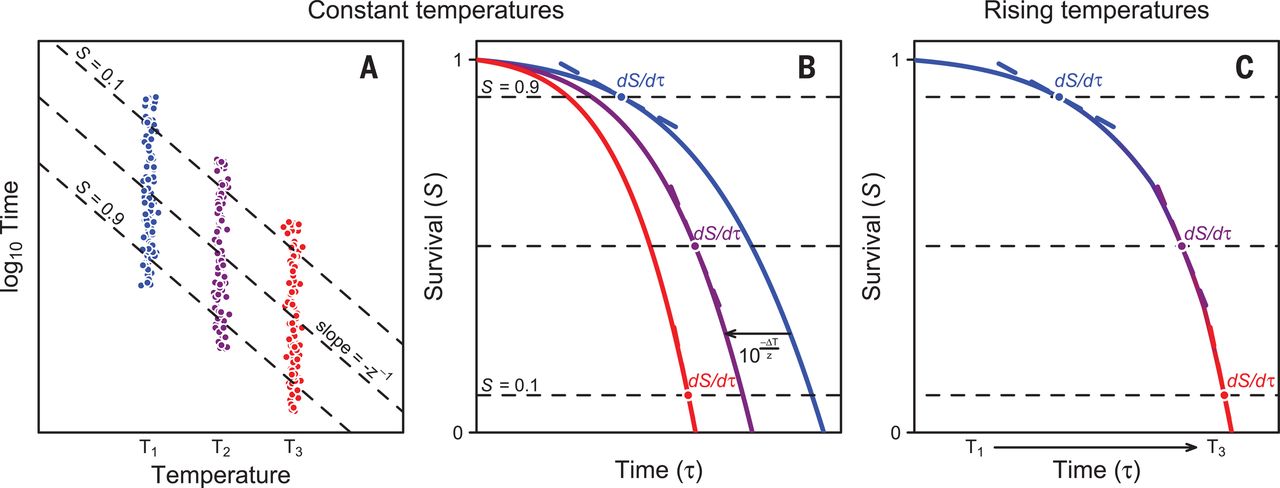
Here, we show that these inconsistencies can be explained with a common theoretical framework, whose main premise is that the cumulative impact of any thermal stress varies with temperature and time. Similar methods are commonly used in the food processing and pest control literature (12, 13), and yet their application in thermal ecology remains contentious [but see (14, 15)]. We previously combined survival probability functions with measurements of elapsed time for thermal death to obtain a continuous “tolerance landscape” at different constant temperatures (16) and now expand this framework to predict survival in a variable environment. The logarithm of survival times varies linearly with temperature (Fig. 1A), and results in parallel thermal death time curves for different relative survivals (S) that can be described with a simple relation between exposure times (τ) and temperature (T):(1)where z > 0 corresponds to the thermal sensitivity describing the ΔT required to change τ one order of magnitude (Fig. 1A and supplementary materials). Thus, if z = 2°C, an organism that tolerates 40°C for 1 min could withstand 38°C for 10 min and 36°C for 100 min. For standardization purposes, hereafter we refer to the temperature at which mean τ = 1 min as Tmax, which corresponds to the temperature at which the linear regression touches the abscissa with log10-transformed τ (Fig. 1A). Equation 1 implies that any survival probability function ST(τ) shifts horizontally by as a consequence of 1°C increase in temperature, and therefore, we can transform any survival probability function from T1 to T2 with the relationship (for notational simplicity, we denote the temperature dependence by lower index):(2)(Fig. 1B). In a variable thermal environment, changes in the survival probability function are coupled to changes in temperature and survival times as(3)(Fig. 1C). The survival rate at any given time τ′ can be calculated by summing up the infinitesimal small changes in the time interval [0, τ′]. This can be accomplished analytically or numerically (supplementary materials).

(A) Time to death under a constant thermal regime varies predictably in a log-linear fashion with body temperature, giving rise to typical thermal death time curves whose slope quantifies the thermal sensitivity z. Data points represent simulated individuals that collapsed during a static assay. (B) In light of this relationship, results from different temperature assays can be expressed using a single survival probability curve that shifts in time by a factor determined by z, increasing or decreasing mortality rates. (C) Using this framework predicted how temporal variation in temperature affects the survival probability curve and, therefore, mortality rates under variable temperature conditions.
We validated the numerical method, which has the advantage of not requiring the analytical form of S(τ) to be defined, by successfully predicting survival responses of several Drosophila species subjected to highly contrasting warming regimes. The dataset (17) comprises 11 species whose survival was measured at constant temperatures between 32° and 43.5°C (n = 1289 individuals) and that were also subjected to warming temperatures starting at 19°C and increasing 0.05°, 0.10°, and 0.25°C/min (n = 504 individuals) until individuals died. Assays lasted between ~1 min and 17.5 hours at constant temperatures and between 1 and 8 hours in ramping experiments, and dehydration or starvation effects (9) were prevented by giving flies access to food and water throughout the trials (17). We initially determined how well a single survival probability curve fitted the data obtained at different temperatures (figs. S1 to S3): We pooled all values into a single S(τ) at mean T and remapped this curve back to each temperature to obtain theoretical estimates of survival (Eq. 2). Across species, Tmax ranged between 38.9° and 44.8°C, and z between 1.81° and 3.53°C. Fitted estimates closely resembled empirical values (Fig. 2A), with R2 between fitted and empirical data ranging between 0.946 and 0.984 for each species (R2 = 0.965 ± 0.012, mean ± SD). Therefore, a single S(τ) for each species can successfully describe survival rates across thermal regimes.

Predictions were validated against heat tolerance estimates obtained empirically in 11 Drosophila species. (A) Fitted versus reported death times under constant thermal regimes, which supports our contention that empirical survival curves obtained at different temperatures can be described by a single survival probability function that shifts in time (Fig. 1). (B) Predicted versus reported death times and (C) lethal temperatures at different warming rates. The dotted line represents the equality x = y and the continuous line an ordinary least-squares regression; points are shown in a color gradient from low (blue) to high temperatures (red).
We then used each species’ survival function to predict how it would respond to rising temperatures (fig. S4). Predicted times and temperatures for collapse were fairly accurate when contrasted against empirical measurements (Fig. 2, B and C). These results highlight that different tolerance estimates correspond to a single trait expressed in different environments, instead of multiple traits presumably under independent genetic control (18, 19), and bridge the gap between measurement reliability and ecological realism (19, 20). With this framework, it should be possible not only to compare species’ thermal tolerances under standardized conditions but also to predict the intensity of selection under natural temperature regimes. Because this model translates probability distributions from static to dynamic conditions using basic calculus, and thermal death time curves are pervasive in terrestrial and aquatic ectotherms (16), the adequacy of this method lies primarily on the appropriate estimation of body temperatures in the field. Although here we assume that body temperature equals ambient temperature, which is reasonable for Drosophila (21), for other ectotherms whose thermal inertia is not negligible body temperatures can be estimated from biophysical modeling and ambient temperature records. However, empirical validation in other taxa remains necessary.
We next explored how estimates of heat tolerance in Drosophila subobscura translate to conditions in the field. This species has been extensively studied and provides one of the most compelling cases for adaptive genetic shifts in response to climate change (22). To predict mortality, we combined the survival probability curves S(τ) of a mid-latitude (33°27′S) population of D. subobscura from Santiago (23) acclimated to 13° and 18°C (n = 237 and 227 individuals, respectively) with the daily thermal profile of this location. Temperatures were obtained with an hourly resolution for 1984 to 1991 and 2014 to 2018 (table S1 and fig. S5). According to the model, the seemingly similar tolerance estimates for cold-acclimated (Tmax = 41.1°C and z = 4.9°C) and warm-acclimated flies (Tmax = 40.3°C and z = 3.7°C) should result in contrasting mortality rates in the field (Fig. 3), primarily because of z, given that mortality is expected at low temperatures compared with Tmax. For cold-acclimated flies, daily mortality >10% is predicted during mid-austral spring, with current thermal maxima in November in the order of 26.8° ± 13°C, whereas for warm-acclimated flies, elevated mortality is only expected during summer, with maxima in January of 30.2° ± 0.9°C. Thus, acclimation has a marked impact on heat tolerance, increasing the window for reproduction by nearly a month from mid-spring to early summer. However, comparisons between 1984 to 1991 and 2014 to 2018 suggest that this window is jeopardized by global warming (Fig. 3).

(A) Averaged hourly temperatures for 2014 to 2018 in Santiago, Chile. (B) Predicted mortality on a daily basis based on these temperatures for acclimated D. subobscura. (C) Cumulative mortality for both 1984 to 1991 and 2014 to 2018. Arrows show the predicted impact of global warming during this 30-year period. The gray lines show the daily abundance of D. subobscura, monitored monthly in the field between 1984 and 1991, expressed relative to each year’s maximum (the shaded area is a convex hull bounding the observed abundances). Mortality cannot be predicted from the critical maximum for this species.
To validate predicted responses in the field, we compared predicted cumulative mortality curves (calculated as the product of the daily survival, which assumes that individuals that survived the thermal stress can recover during the night) against reported fluctuations in the population size of D. subobscura under natural conditions from a long-term longitudinal study in a field population from Santiago (24). The daily abundance of D. subobscura was monitored monthly between 1984 and 1991 and exhibited a marked seasonal periodicity, with the number of collected individuals ranging from 1.0 ± 1.1 by the end of the austral summer (March) to 439.9 ± 218.6 flies in the abundance peak in mid-spring (October and/or November). Every year, the number of caught flies increased roughly exponentially as temperatures rose from winter to spring and collapsed by mid-spring and early summer as predicted by the cumulative mortality curves (Fig. 3). The temporal window in which population collapse occurs involves maximum temperatures that are up to 10°C lower than the published heat tolerance estimates for D. subobscura, which range between 35.1° and 38.6°C under gradual heating (Fig. 3).
Our analysis suggests that strong thermal selection occurs over time at temperatures that are low in comparison with estimated upper critical thermal limits. We cannot discard competitive interactions with other drosophilids coexisting with D. subobscura (24) that might affect its distribution and abundance in summer (25) or other factors (such as ontogenetic variation in thermal sensitivity) affecting the physiological status of the flies. However, our results match patterns observed for chromosomal inversion polymorphisms, in which strong selective shifts were detected at temperatures that seldom surpass 30°C (26). Analyses also highlight that measurements of critical temperatures may seriously overestimate warming tolerance (10, 27) because a low thermal mortality on a daily basis will accumulate over time (Fig. 3). For instance, a nearly imperceptible daily mortality of 1% results in a cumulative mortality of ~20% after 3 weeks (1 – 0.9921). And these predictions might be conservative, as they ignore the thermal impact on fecundity (28).
Temperature tolerance has been studied in comparative physiology for many decades (29), and here we propose a paradigm shift from a static critical limit to a dynamic, more realistic and theoretically sound framework (12, 13). Our model provides an intuitive tool to assess how laboratory measurements translate into differences in survival in the field, which may be expanded in future analyses to include other factors, such as thermal heterogeneity in the environment, behavioral thermoregulation, ontogenetic variation in heat tolerance, or thermal inertia. This framework is not restricted to Drosophila. In principle, it is readily applicable to other small ectotherms whose survival can be adequately measured in the laboratory and thermal microhabitats estimated accurately in the field (30).
References and Notes
- ↵
- ↵
- ↵
- ↵
- ↵
- ↵
- ↵
- ↵
- ↵
- ↵
- ↵
- ↵
C. R. Stumbo, Thermobacteriology in Food Processing (Academic Press, ed. 2, 1973).
- ↵
S. Wang, J. Tang, J. D. Hansen, “Experimental and simulation methods of insect thermal death kinetics” in Heat Treatment for Postharvest Control, J. Tang, E. Mitcham, S. Wang, S. Lurie, Eds. (CAB International, 2007), pp. 105–132.
- ↵
- ↵
- ↵
- ↵
- ↵
- ↵
- ↵
- ↵
- ↵
- ↵
- ↵
- ↵
- ↵
- ↵
- ↵
- ↵
- ↵
-
E. Rezende, F. Bozinovic, A. Szilágyi, M. Santos, Dataset and scripts from: Predicting temperature mortality and selection in natural Drosophila populations. DRYAD (2020).doi:10.5061/dryad.stqjq2c1r
Acknowledgments: The authors thank L. D. Bacigalupe, R. B. Huey, M. R. Kearney, R. F. Nespolo, and one anonymous reviewer for helpful comments. Funding: This work was funded by FONDECYT (grants 1170017 to E.L.R. and 1190007 to F.B.) and ANID PIA/BASAL FB (0002-2014 grant to F.B. and E.L.R.). M.S. is partially supported by the MTA Distinguished Guest Fellowship Programme in Hungary, and A.S. was supported by the National Research, Development and Innovation Office (NKFIH grant GINOP-2.3.2-15-2016-00057) and a Bolyai János Research Fellowship of the Hungarian Academy of Sciences. Author contributions: E.L.R., F.B., and M.S. designed the study, and A.S. formalized the analytical model. E.L.R. and M.S. compiled the data, performed all analyses, and wrote a first draft. All authors contributed to the final manuscript. Competing interests: The authors declare no competing interests. Data availability: All the data and R scripts used in this study are available at DRYAD (31).
