Mosquitoes, ticks and pollen could be mainstays of fall as climate change extends summer heat.
For meteorological fall (Sept. 1), we’re updating popular fall analyses, including:
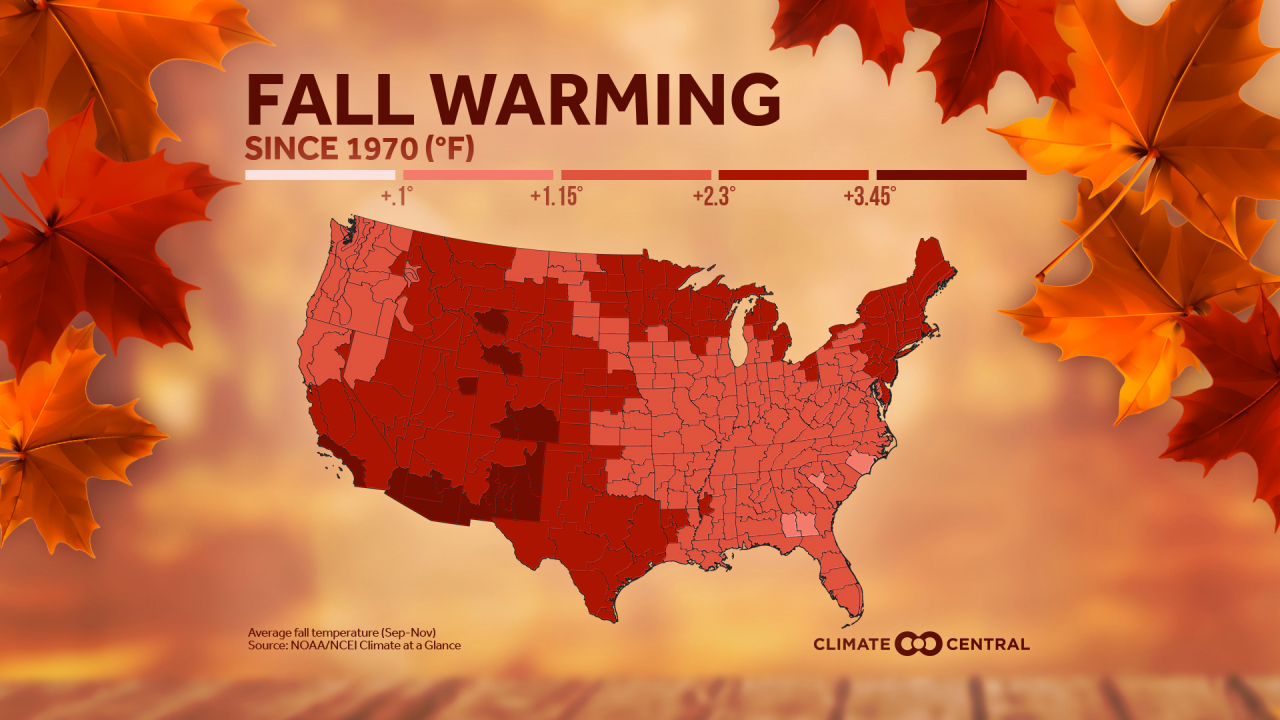
- Average Fall Temperatures (local trend and a national map)
- Fall Days Above Normal
Of the 242 cities analyzed, 95% (230) reported an increase in their average fall temperatures since 1970. Of the cities that recorded an increased trend, 52% (120 of 230) experienced warming of more than 2℉. This trend is observed across the nation, but the top five greatest increases in average fall temperatures are clustered in Texas and the Southwest region. Reno, Nev. easily garnered the first place spot with the highest increase of 7.5℉, not far followed by Las Vegas, Nev. (5.7℉), El Paso, TX. (5.4℉), Tucson, Ariz. (5.1℉), and Phoenix, Ariz. (5℉).

The number of fall days above normal also reflect a warming trend. Our analysis revealed that 64% (155) of 242 cities recorded at least seven additional days above their normal fall average temperature since 1970. Further, eight cities saw at least 30 additional days—a whole month—above normal, with Reno, Nev. reaching almost 43 more days.
The extended warmth may sound inviting to some but has implications, such as an extended season of disease-carrying mosquitoes and ticks and higher cooling demands as air conditioners run later into the year. A warmer fall is also bad news for allergy sufferers because delayed cooler fall temperatures extend the growing season—and thus, the allergy season. In the past 12 months, there were 12 million physician office visits for hay fever, and this number will only rise as plants, like ragweed, continue to produce pollen later into the fall months.

METHODOLOGY
Fall (September through November) trends were calculated using data from the Applied Climate Information System from 1970-2019. Fall days above normal are relative to the 1981-2010 NCEI climate normal. Changes in average temperature since 1970 for US climate divisions were calculated using data from NOAA/NCEI. Displayed trend lines on city analysis are based on a mathematical linear regression. Climate Central’s analyses include 244 states, however, only 242 stations are included due to large data gaps in St. Johnsbury, Vt. and Wheeling, W. Va.
