
Overview
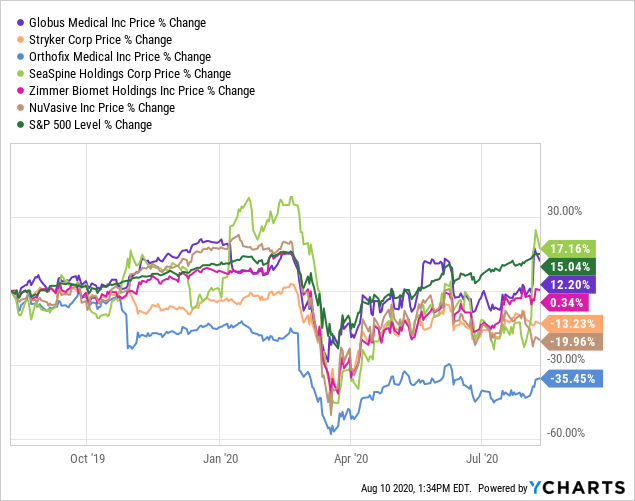
The medical device company Globus Medical (NYSE:GMED) has beaten The Street’s Q2 EPS estimates, scoring a surprise of $0.07 earnings per share exiting the second quarter. Revenues also surpassed expectations by 49.3% over this most recent period and consequently, the stock has rallied 18.12% over the past 5 days on the back of the positive news. These results are an elation for GMED, who has missed earnings estimates 3 out of the last 4 quarters; however, while the numbers show benefit to investors, revenues posted were actually a significant decrease of 23% YoY. With the tenacity of the novel Coronavirus placing uncertainty over the company’s existing medical device markets in the short-term, visibility of future performance coming out of 2020 is the critical factor for investors to weight for the investment case.
Thus, we advocate potential investors into this company tread with caution and adopt a strategy and thought process similar to what we advocate below, in order to ride out the remainder of the pandemic with a risk-averse mentality and a short to medium-term horizon in mind.
Investment Thesis
GMED has climbed 18% over the past 5 days and 25.74% over the past month, although is down around -4% YTD. We feel that the short-term trend is likely to continue slowly north on the back of an interesting quarter performance, alongside strong sales and FCF growth projections moving out of 2020. We base this partially on research that demonstrates high covariance between short-term price movements and surprises in earnings estimates, amongst other factors. The share price is trading within 5.5% of its all-time high in December 2019, up from $35.06 in March and is fighting well against comparable companies discussed throughout this report, to illustrate. Therefore, with fantastic solvency coverage from cash on hand coupled with manageable debt totals, the investment case is bolstered from company’s comparative advantage and on the back of these price and fundamental momentum factors.
 Data by YCharts
Data Source: ValueLine GMED; Author’s Calculations
We see favorable upside potential in light of recent returns, particularly on the back of the Q2 earnings surprise and positive outlook for the remainder of 2020.
We have therefore scored return on capital employed, return on equity, FCF and a few other measures to gain an insight into the investment opportunity; while assessing risk on the basis of historical downside potential, the entities ability to remain solvent amongst other risks to the company’s operations, to arrive at a guidance that we believe will limit risk exposure and allow a fair entry point for shareholders to realize gains over the short to medium-term.
Profitability & Solvency
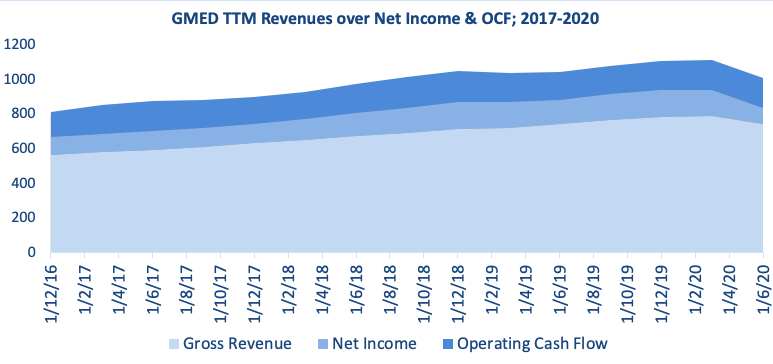
Gross revenues and Net Income for the Q2 exit were $148.9 million and -$20.8 million on margins of 66.01% and -13.97%, respectively. OCF for the TTM totaled $175.54 million, showing an increase of 11.19% since June 2019. Leading up to June 2020, GMED has posted revenue growth at a CAGR of 8.43% over the 5-year period to date, however net income has seen negative CAGR of -2.2% over this same period, primarily from the results experienced this year from Covid-19 related market turmoil. Overall, net income has decreased by -39.88% since March.
Although revenues decreased by -23.44% YoY following cancellation of selective and non-emergency surgery in the US and throughout the globe, COGS jumped from $44million to $50.6 million, a 15% increase. For example, US sales decreased by 22% whist international sales of their product line (including robotics) fell 31% since Q1 2020, however higher COGS were caused by write-downs of excess, obsolete and non-recurring inventory classes coupled with higher manufacturing costs. For instance, GMED commenced a recall of specific lots of the Altera interspinal spacers, as they contained traces of stainless steel instead of the preferred cobalt that is generally utilized in these prostheses, which the company commenced in July.
Data Source: ValueLine GMED; Author’s Graphic
 Data by YCharts
While overall sales results have been less than impressive over this most recent period, the company’s posture on free cash flow has certainly stood out to us, with GMED eliciting a CAGR increase of 18.31% in FCF over the TTM, thus giving light to the company’s ability to generate additional revenues moving into 2021. FCF for this quarter showed a TTM total of $115.41 million on a margin of 9.61% and is poised to expand 40.37% by December 2021, but not before a significant decrease over the remainder of the year; figures we obtained from linear regression on the consensus of analyst estimates. Coupled with reinvestment into NWC growth of 18.21%, we feel the company is demonstrating a proactive growth strategy in the current climate and using its cash resources satisfactorily. To highlight, in Q2 GMED acquired the Finnish company Synoste, whom specialize in providing engineering grade solutions to the limb lengthening research market, for $25.3 million. The acquisition lies in parallel with GMED’s stance on solutions to neuromusculoskeletal disorders and consequently, by this analysis we feel is a good fit to its existing markets.
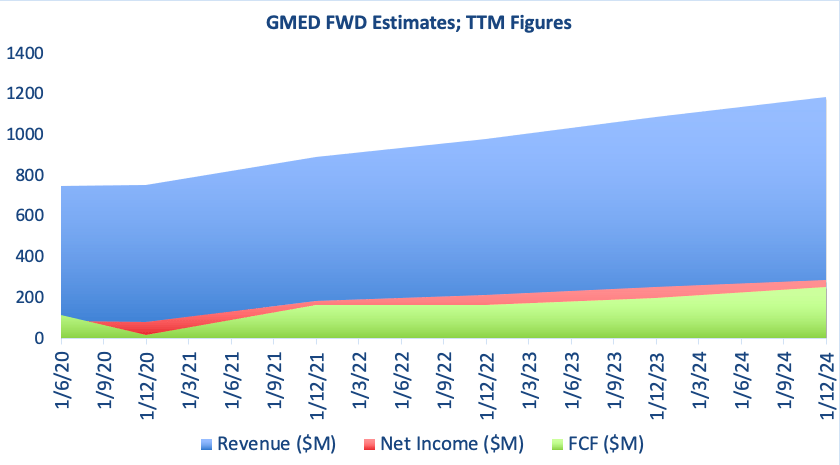
Data Source: ValueLine GMED; Author’s Graphic; Figures obtained using linear regression on the consensus of analyst estimates.
GMED currently has cash and equivalents plus marketable securities of $636.2 million which is a sizeable cushion considering the company’s level of operations. On a short-term solvency ratio of 6.57x coverage, the company should certainly meet its shot-term obligations as they fall due, and if unable to sell inventory quickly, there is still 4.27x coverage from liquidity measures on hand. Interest coverage is also well managed with 5.98x coverage on TTM interest expense figures and GMED also currently holds $3.34 in cash per share. We are satisfied with the CF/Share figure and feel it fits in line with our postulated momentum in share price, as we see the current price off its 52 week high on sound gains of 6.7% over the 6-month period to date with FCF on the rise. Thus, we will be unsurprised if trends continue slowly north over the medium term.
Capital Return
GMED has generated 7.3% in returns on capital employed over the single-period to date, down from 17.4% 3-years ago. This is not alarming, considering the slump in sales activity and cash generation from the invested capital secondary to Covid-19 related restrictions on surgical and medical procedures this year. We are happy if the figure remains above 5% in mid-cap Healthcare companies who evidence satisfactory asset turnover and return on the asset base.
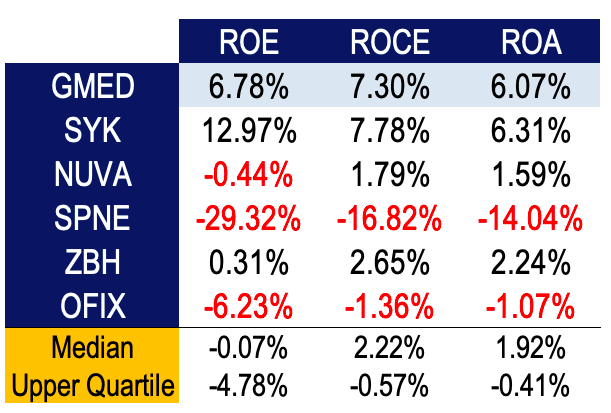
Data Source: Value Line GMED; Author’s Calculations
GMED scores ROA of 6.07% and generates around 52 cents from every dollar invested in the asset base, which is in line with our examination of ROCE. In relation to the 5 comparable companies we have investigated for this analysis, GMED presents a favorable landing for investors to allocate capital, well above the median score for each metric, trailing behind Stryker Corporation (SYK) only. Return on equity for GMED is particularly sound as well, particularly in comparison to NuVasie incorporated (NUVA), SeaSpine Corporation (SPNE), Zimmer Holdings (ZBH) and Orthofix Medical (OFIX) who each have registered poor returns for equity shareholders over this most recent period to date.
By way of this demonstration, GMED has maintained adequate return on its capital deployment and is positioned well to generate additional ROCE, which we firmly believe can translate into shareholder returns coming out of the pandemic – particularly as elective and non-essential neuromusculoskeletal surgeries recommence in the near term.
Valuation
GMED is currently trading at a premium P/E multiple of 65.03x which would reflect market expectations of investor sentiments coming out of 2020. Additionally, GMED is trading high on the P/Sales, P/CF and P/FCF fronts, aloft each of the industry comparables we have included in our examination. We firmly believe this reflects the company’s superior ROCE and asset turnover, alongside the market pricing in GMED’s future performance expectations as the Healthcare system unwinds from its Covid-19 related mangrove nest. We observe NUVA, SPNE and OFIX registering blank scores in some metrics secondary to their lack of profitability over the recent time period, thus rendering particular calculations difficult.
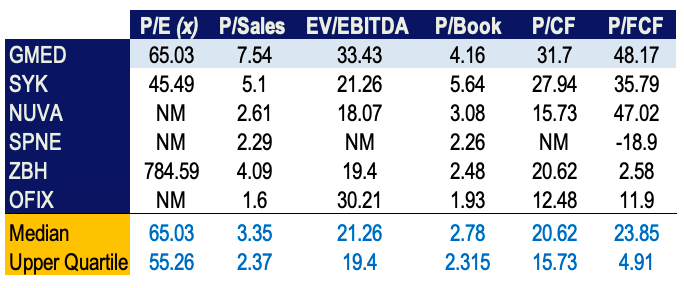
Data Source: ValueLine GMED; Author’s Calculations
We also see the high P/FCF measure as an indication of the company’s capacity to generate additional revenues for shareholders into the near-term. Additionally, the P/Book figure of 4.16 we are equally as satisfied with; although it is high in relation to 4 out of 5 of the comparables, we look to this measure to signify value creation for shareholders. A score above 1 we deem as important because it represents that value has been created for shareholders above and beyond book values. We see this value creation in the form of FCF, price returns and revenue gains, over net income and lack of volatility, to demonstrate. We wouldn’t like the P/Book figure to climb higher than present, however. Furthermore, we pay less attention to the P/E multiple at this stage, particularly as our Ultra Growth Portfolio has seen unrealized returns of 58.69% YTD and is partially comprised of large allocations from the FAAMG group – i.e. Facebook (FB), Apple (AAPL), Amazon (AMZN), Microsoft (MSFT) and Alphabet (GOOG) who are each trading at high P/E multiples relative to the S&P 500 (SP500) index, to illustrate the point here.
Data Source: Author’s Calculation’s
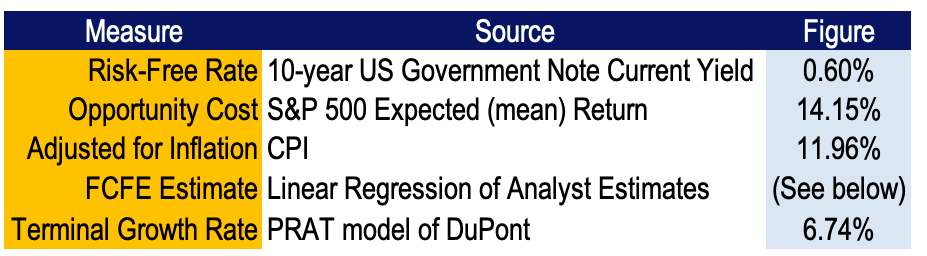
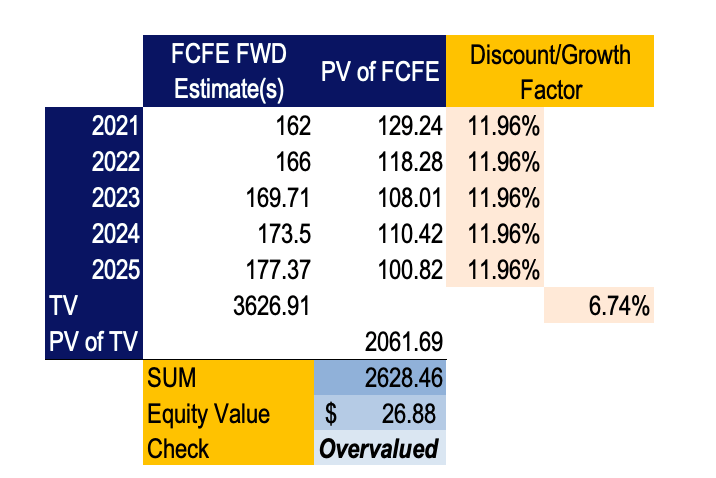
To add weight to our valuation model, we have examined FCFE obtained by performing linear regression on the consensus of analyst estimates. We are accustomed to using the PRAT model of DuPont in assigning a terminal growth value in our estimates and generally incorporate the opportunity cost of holding the S&P 500, using the expected (mean) return as the proxy in addition to the 10-year US Treasury yield for the discount rate. As such, we have determined a fair value of $26.88, which for us is out of sync with the stock price. We need to see greater evidence of ongoing expansion of ROCE and shareholder returns to justify the valuation here. We have performed a sensitivity analysis over the valuation inputs to determine the range of fair values one would expect to see when using alternate perpetual growth rates and discount factors below.
Data Source: Author’s Calculations
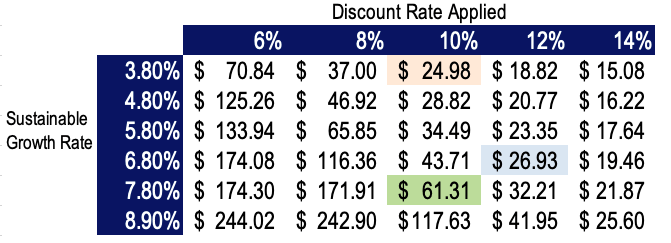
We would see the stock as undervalued with an ~1% increase in our perpetual growth rate that was assigned in the model. Ceteris paribus, we would advocate that it is not unlikely when using the PRAT model we would see a valuation closer to the $61.31 mark provided net income expands over the coming quarter, thus set our upside target range at $62 on the current entry point of $54.99.
Strategy
We do not necessarily advocate for an immediate entry at current trading of $54.99. We instead are opting to wait for a sharp pullback in the range of 10-15%, or $47.81-$49.99, roughly $5-7 a share. We feel this increases the upside on current momentum and also gives us a greater reallocation scale back up to ~$55, which is not unlikely considering current price momentum and the reopening of the surgical arena throughout the larger global states. We are in favor of allocating 0.1-0.5% of our NAV in positions that we foresee as a medium-term holding period such as in this case, provided the fundamental and price momentum remains strong over a specified period.
To partially manage risk, particularly in these turbulent times, we are opting to keep our allocation as a percentage of NAV quite small in all new positions as mentioned. Such would be the case with an entry point for GMED as well. This way, we can exit without too much pain if things go south, plus it gives us wiggle room to test and refine our hypotheses, particularly in the case of GMED where returns will be influenced heavily on performance for the remainder of FY2020. We also include an options hedging strategy in our risk control profile, however it is not discussed here.
We believe there is a fundamental case for the bullish outlook, plus we would be happy to buy the whole company, looking at it from that perspective, considering the comparative advantages within the neuromusculoskeletal interventions landscape. Having worked as a rehabilitation Physiotherapist in the past conducting countless rehabilitation directives for patients receiving spinal surgery, it can be deduced here the superiority in the allotted spinal reconstructive procedures that GMED is offering to these surgical candidates by my best estimation.
Furthermore, we intend to opt for a short to medium-term holding period, versus long-term allocation, particularly in light of the disruptive nature within medical devices that occur without adaptability and ongoing solvency. GMED has demonstrated to us they are capable here, however we would plan an exit after 1-3 years, defining that as our medium term horizon. Although we are in favor of longer-term holdings, it is also recognized that one may benefit greatly from taking profits earlier considering the volatility to the downside that may occur in light of recent advancements in Covid-19 cases around the world causing more pandemonium to equities markets. Therefore, we certainly don’t rule out exiting after 3-6 months either in a profitable position, provided we are convinced the legs for additional company growth are outweighed by the risks to the company and to shareholders.
Further Considerations
The company has a comparative advantages within the spinal surgery domain. GMED produces implants for more “traditional” spinal surgeries such as fusions and screw and rod procedures, including fusion implants and pedicle screw and rod systems, alongside spacers for intervertebral disc pathology and corpectomy procedures involving the vertebral body.
As such, there has been a pioneering in devices from GMED on this front, having developed additional systems that allow for vertebral interbody fusion, dynamic stabilization interventions, vertebral disc replacement, intervertebral traction alongside biological products that include allografts of disc and osseous material plus synthetic variants of the same. Such interventions are viewed as advanced secondary to the adaptability to the patients’ anatomical features, particularly with the intervertebral and osseous anatomical variations that exist between us as humans.
In layman’s terms, the company has launched methodologies that allow experts and surgeons alike to mould spinal surgery so that is specific to the patient’s anatomy and presenting condition, be it pain related or from a structural cause.
In light of this, the company relies on the operations actually taking place, and as such has been impacted by the postponement of elective and non-essential spinal surgery from Covid-19. It is obviously a necessary step to free up hospital space and resources to treat the pandemic, however the length of time that it will take to reopen is cause for uncertainty. Cash burn as a percentage of total revenues was $15.93 million per month for the quarter leading to June, which gives a solid cushion of ~39 months considering the company’s bastion of cash to continue operations moving to the end of FY2020 and into 2021. Good news for GMED in our estimation.
Conclusion
GMED certainly is on our radar albeit at a lofty valuation from our analysis. We will be paying very close attention to the effect of ongoing performance to our inputs for the PRAT figure in our valuation model, to garner a greater understanding for how this will impact the current valuation, as it is quite possible the company will deliver a strong Q3 and Q4 for 2020. Thus we foresee an exciting entry point on the figures that are aforementioned in the analysis above, even upwards to 15-20% of the same. We will especially enclose on a sudden pullback where we can capitalize on our planned entry and allocate a small percentage of NAV to allow for an easier exit if risks prevail, while allowing opportunity to take profits earlier than expected if the share price continues at a sharp momentum and gives the run up we are searching for. Additional coverage to come in Q3.
Disclosure: I/we have no positions in any stocks mentioned, but may initiate a long position in GMED over the next 72 hours. I wrote this article myself, and it expresses my own opinions. I am not receiving compensation for it (other than from Seeking Alpha). I have no business relationship with any company whose stock is mentioned in this article.
