
Cardano currently stands at 8th rank with a market cap of $3.46 billion. With the coin trading at $0.1329, the coin is stuck moving sideways with no proper destination in sight.
Cardano 1-day chart

Source: ADAUSD TradingView
The price has 3 possible directions to move, up, down, or sideways. However, discerning which direction is largely dependent on bitcoin. Since bitcoin sways the market, its direction will be followed by ADA.
Considering bitcoin’s price drop earlier today, there will be a retracement higher and closing above $11,500 would be extremely bullish. Hence, if bitcoin heads higher, then ADA will most certainly follow its lead. However, with the way things are right now, if Cardano fails to successfully close above $0.1387 and test it as a support, then heading down to $0.0936 seems likely after testing intermediate support at $0.1207.
Looking at RSI, it has recently tested the overbought zone and is heading lower, hence, a drop seems more than likely. To confirm a drop, the price on the daily time frame has to close below the 21-DMA [orange] aka 0.1311, and just to be unbiased, a close below the aforementioned intermediate support at $0.1207 would be good to open a short position.
Good targets are 50 DMA [yellow] at $0.1098 and $0.0936, which are 17% and 29% drops from the current price levels. Another point to be considered here is that confirmations are a must and shorting without them would be risky.
The worst scenario would be if bitcoin faces another crash filling the CME gap at $9,600. This would absolutely destroy the aforementioned supports and head to the 100 DMA [pink] at $0.0842 and 200 DMA [purple] at $0.0648.
Cardano weekly chart
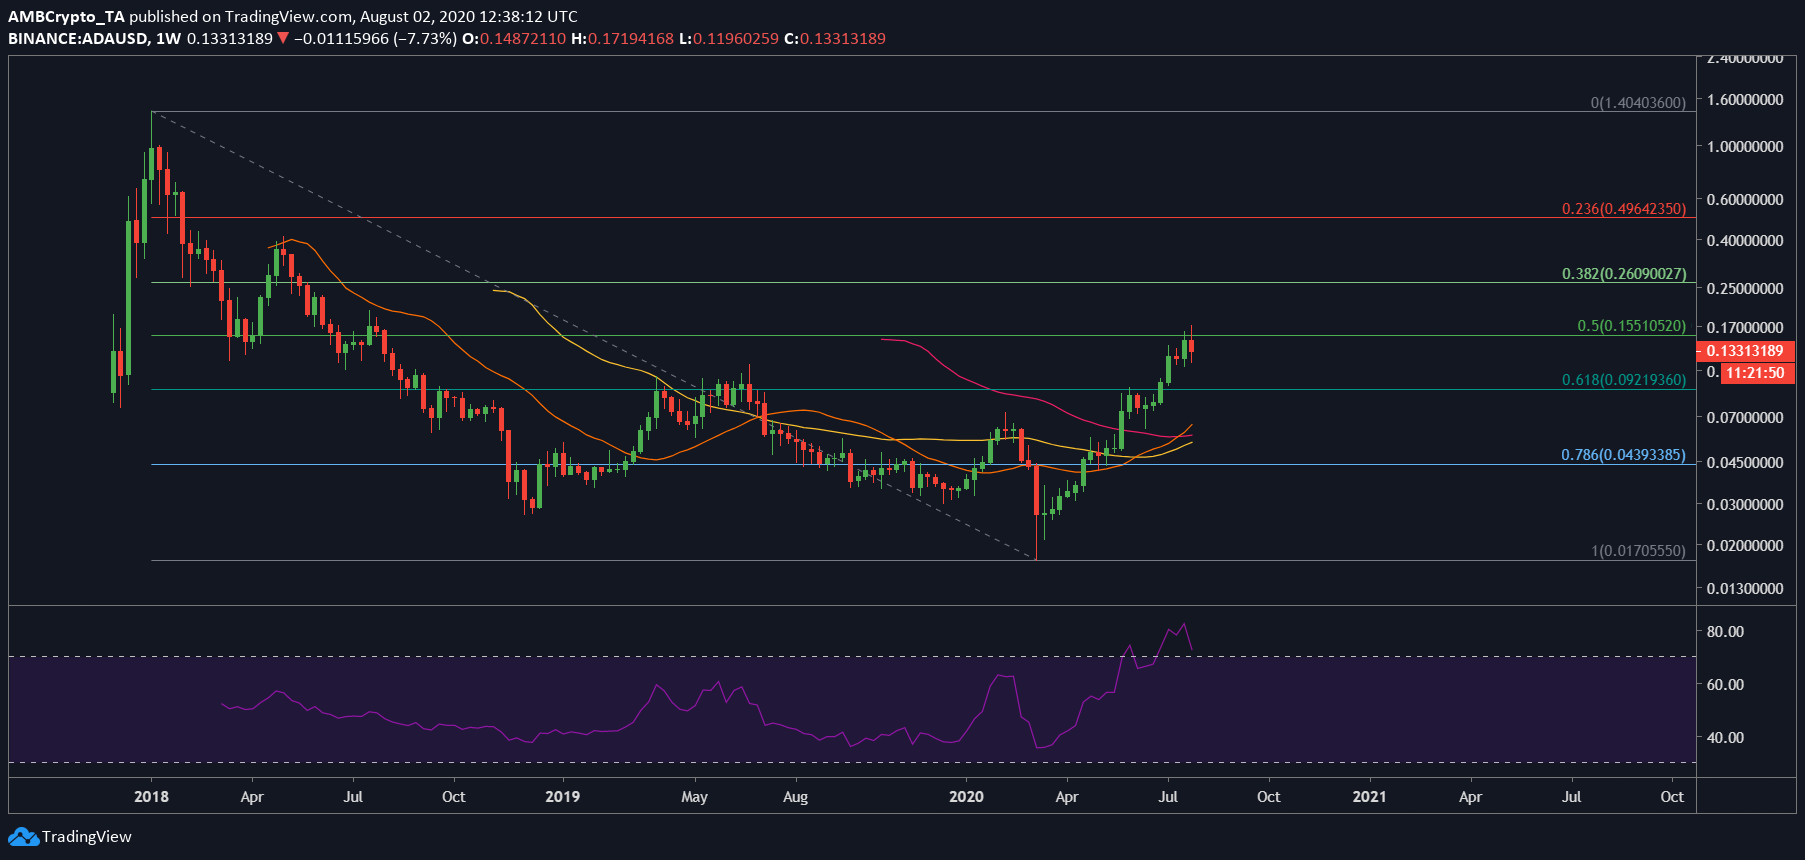
Source: ADAUSD TradingView
Additionally, the weekly chart looks bad as the price seems to be facing rejection at 0.5-fib level [at $0.1551] level. RSI on a weekly time frame has blown out the overbought zone and a reversion to the mean seems more than likely. Hence, a short position for ADA seems more favorable.
