
Investment Thesis
We are extremely bullish on Thermo Fisher Scientific (NYSE:TMO) and believe that the company has the fundamental momentum coupled with the economic pillars to provide shareholders excellent total returns in the coming periods.
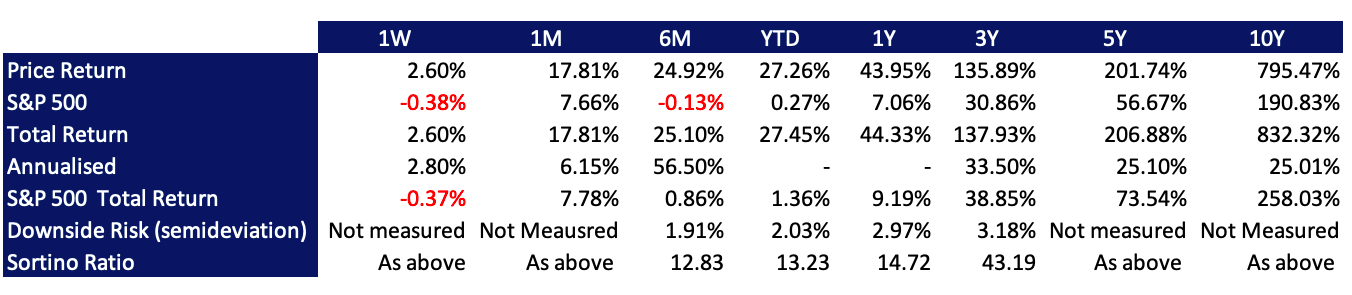
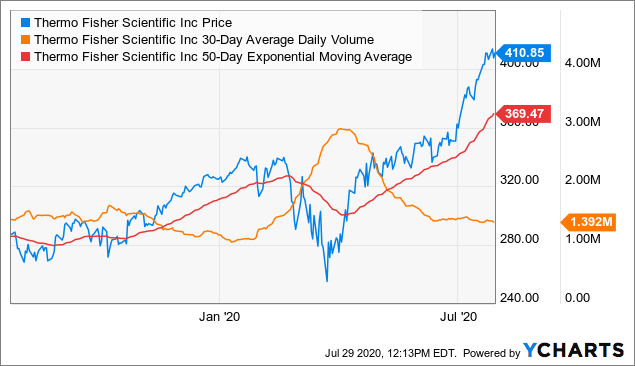
Currently, the market views TMO as one of the most promising entities within the pharmaceuticals, medical supplies and biotechnology sector(s); as such, share price has seen momentum of 48.5% on 4.13% risk to the downside since the market selloff in March. Shareholders have also enjoyed 138% in total returns over the 3-year period to date with a 5.8% downside risk on monthly returns over the same term (monthly returns utilised for the scope of medium to long-term players).
Data Source: Market Data; Author’s Calculations
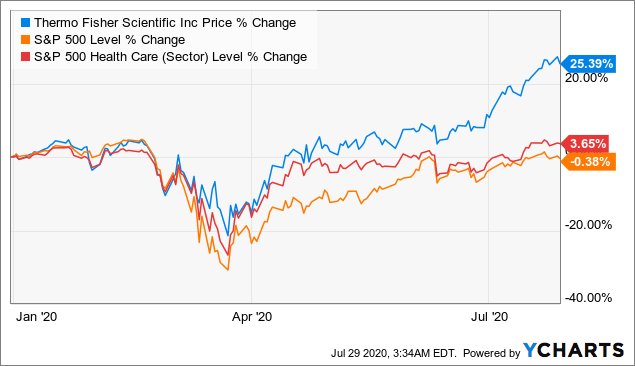
Moreover, earnings results for Q2 2020 were recently posted on July 22 with pleasing results for shareholders, beating revenue expectations by $9.17 million and EPS by $1.00, whilst currently trading at its all-time high of $407.36 (at time of writing), registering a YoY holding period total return of 44.33% to today’s date, and thus presenting an exciting entry point for those considering a longer horizon. The company has also outperformed the greater market total return by 26.1% YTD and has elicited 23.6% returns over the S&P 500 Health Care Sector over this same period.
 Data by YCharts
The company has delivered said returns on a background of many factors; including, but certainly not limited to:
| 5-year CAGR growth in revenues of 9.6% |
| Robust operating and revenue margins |
| 14.5% CAGR in FCF over the previous 3 years |
| 138% total returns to shareholders over the 3-year period to date |
| Demonstrated competency in governance |
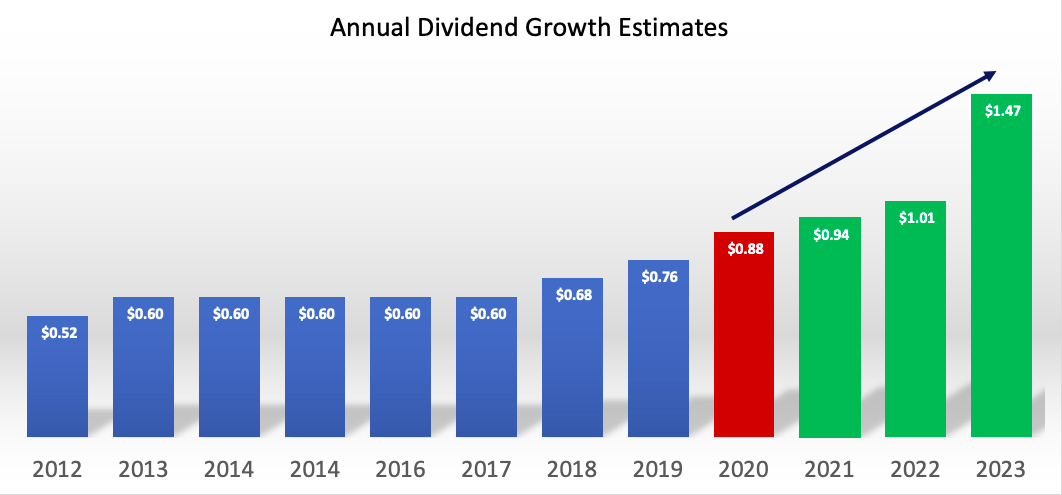
| 69.23% increase in annual dividend payouts from 2012 |
| Sustained quarterly dividend payout this YTD of 22 cents/share pointing to annual dividend payment of $0.88/share in 2020 |
| Ongoing expansion in return on capital employed (ROCE) |
Data Source: Value Line TMO; Author’s Calculations
Consequently, the company presently trades at valuation multiples either in line or below market expectations which are outlined in this report, thus bolstering our long position case and the call for entry for a medium/long-term holding period. We do not discuss an exit strategy over this term here.
On further examination, we believe the company will continue to earn above-market returns, delivering equally as satisfying results to shareholders into the future and is a buy on value for the following reasons:
- Macroeconomic considerations –
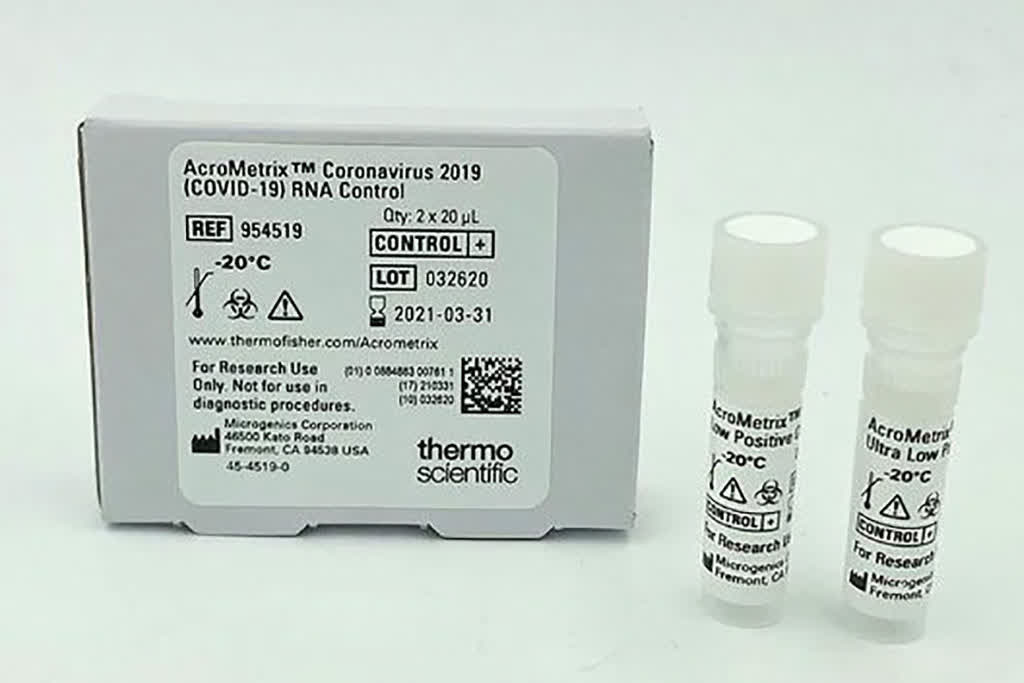
Given the novel coronavirus (COVID-19) uncertainty heading into 2021, the citadel protecting the company has significantly broadened on the back of fulfilling global demand for COVID-19 related medical supplies, generating around $1.3 billion in sales relating to the pathogen this year to date, whilst procuring large-scale tenders under the US Government alongside the Mayo Clinic and WuXi Diagnostics.
- TMO’s posture on growth –
Key metrics including ROA, ROE, FCF, ROCE, profitability in gross sales and dividends are above the median for our set of 5 comparable companies, and these figures are poised for ongoing expansion over the next 5-year period at a minimum. Exact figures are discussed below.
- Solid FWD operating margins on OCF of $5.27 billion –
OCF margin of 76.12% and 20% operating margin for Q2 both showing YoY growth, alongside liquidity preservation measures in place. There are no foreseeable drains or pulls on liquidity.
- Transparency from leadership –
Evidencing competency in management strategy and providing clear guidance for 2020/2021.
- Debt facilities are well covered –
Coverage is sound from an OCF, FCF and interest payment standpoint, with short-term solvency equally as sheltered by cash and short-term assets. The company’s issued bonds are payable on a semiannual basis at 4.133% and are non-floating issues.
- Adequate dividend coverage with FCF of $4.245 billion –
Coverage from FCF and estimated annual net income of ~$4.5 billion in 2021 with sustainable payout ratio incentivising future shareholders.
- High historical total returns with tolerable downside risk and upside potential ratio of 15.97% on monthly returns –
Although not indicative of future returns, the market has certainly foreseen the potential in future cash flows for the company, valuing the share price at its all-time high at present on a background of the above point (at time of writing).
- Repeated history of compounding reinvestment into net working capital with 162% growth in NWC investment YoY –
Generating leading products and services in the Life Sciences, Tools and Services industry, particularly in response to the coronavirus pandemic.
- Consistently ahead of earnings estimates –
The company has beaten analyst’s estimates each quarter over the last 2-year period in both revenues and EPS.
- Strength in valuation metrics, particularly P/CF, P/Sales, Justified FWD P/E and P/FCF –
Furthermore, on a comparable basis also, the company evidences the ability to generate additional revenues for the itself and its shareholders. These valuation metrics also demonstrate the expectations from the market and are favourable relative to peer companies within the industry, discussed below.
To provide supplementary analysis to the investment case, we present 3 scenarios in our model. Inputs in each scenario include:
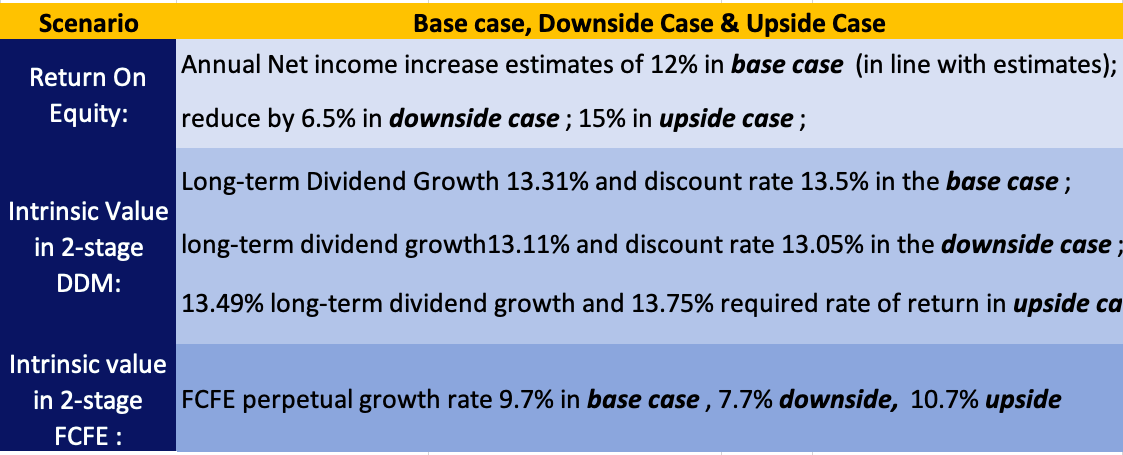
In its current position, TMO is positioned to adhere to the base or upside case, especially as the company is demonstrating fundamental momentum relative to the market and comparable companies of a similar profile.
In the event of forecasting risks panning out, we hold in-the-money option positions against any unfavourable price movements in the short term, to hedge against value erosion of the investment outlay.
Profitability
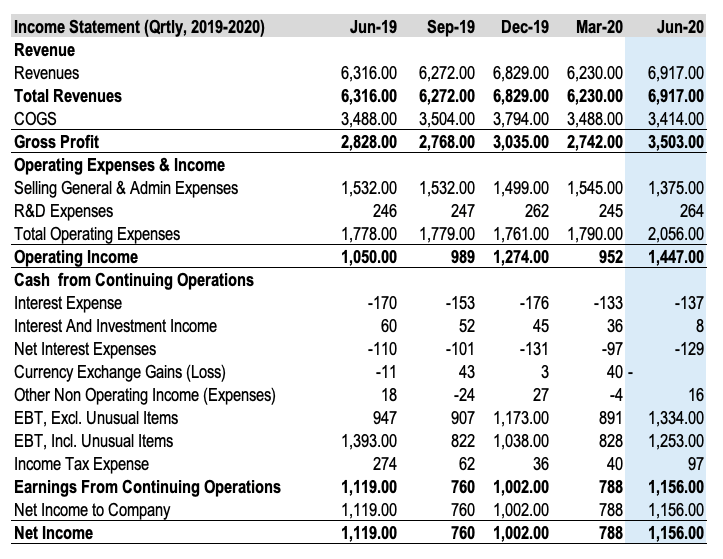
TMO generated $6.917 billion in TTM gross revenues on a margin of 45.52% from the most recent filings. This is up from the previous period, which is certainly pleasing. EBITDA and net income from this figure were $2.019 billion and $1.15 billion, respectively, with OCF of $5.272 billion available on an annual basis for continued operations, thanks in part to sales pertaining to COVID-19 medical and safety supplies. OCF margin is quite satisfactory at 76.12%, and the company shows an operating margin for Q2 of 20.1% to support expansion of products and services in reply to increased demands.
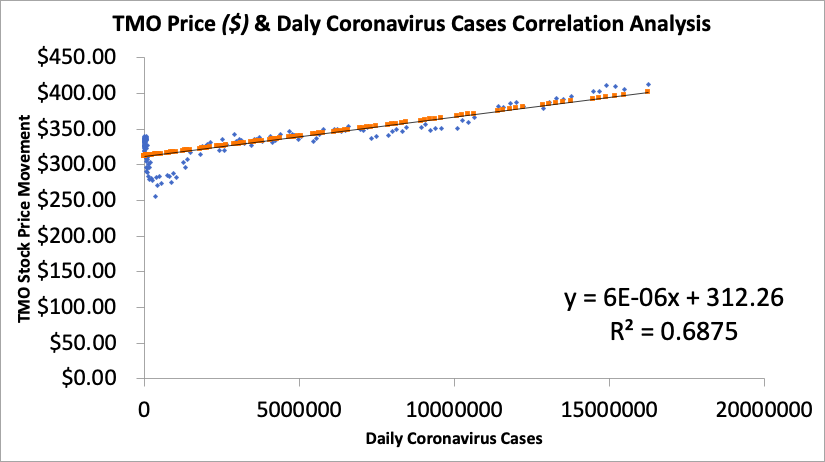
Interestingly, there seems to be a moderate amount of positive correlation and causation of daily coronavirus data and price movements of TMO stock price:
| Regression Statistics: | |
| Correlation | 0.82918057 |
| R Square | 0.68754041 |
| Adjusted R Square | 0.68532438 |
| Standard Error | 17.1930842 |
| Observations | 143 |
Data Source(s): Seeking Alpha, Our World in Data; Author’s Calculations
The correlation measured between the movement of the 2 daily figures is positive at approximately 83%; however, correlation does not mean causation. The R square figure is the coefficient of determination, illustrating that around 68.75% of the price movements in TMO’s daily share price from 1st January 2020 may be attributed to changes in recorded daily coronavirus cases throughout the world. On the basis of this, moving forward, I feel this is an interesting metric to watch over, particularly noting any deviation in the coefficient of determination figure over time: if cases increase drastically worldwide, then there is a chance TMO’s price returns may reflect the same based on this data. These results perhaps are on the back of the market favouring TMO as a leading provider or COVID-19 medical and safety supplies and as investors fly to quality amidst market turmoil, TMO has shone as a hot contender for the same.
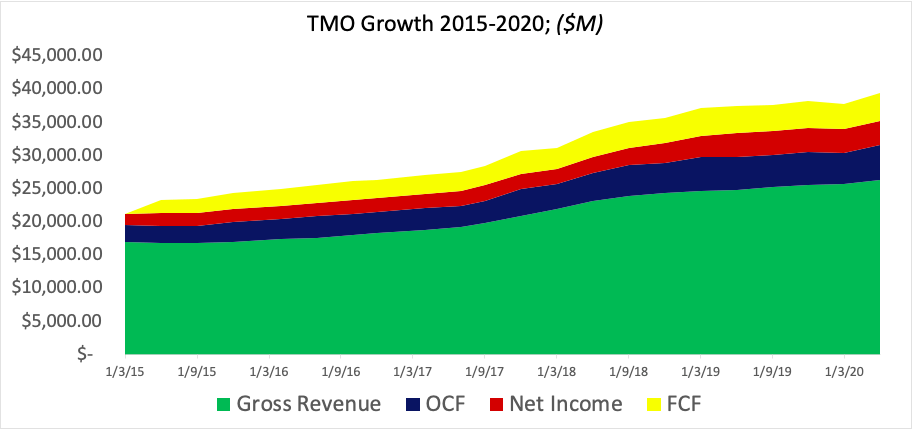
Data Source: Value Line; Seeking Alpha; Author’s Calculations
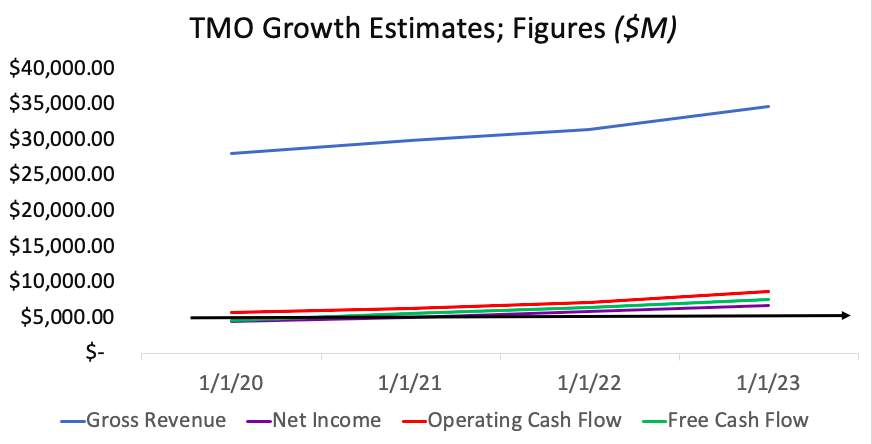
Revenue has climbed at a CAGR of 9.6% over the 5-year period to date and shows no sign of slowing. Revenue growth of 23.6% is expected over the next 3 years, obtained using linear regression from the consensus of analyst estimates. Expansion in OCF over this period is expected by 23.7% again from linear regression of estimates, having enlarged by 63.75% over the previous 3 years to date. Further increases are more than likely, as cases of COVID-19 continue to resurge following the slow reopening of the economy, and health resources are continued to be drained from the same.
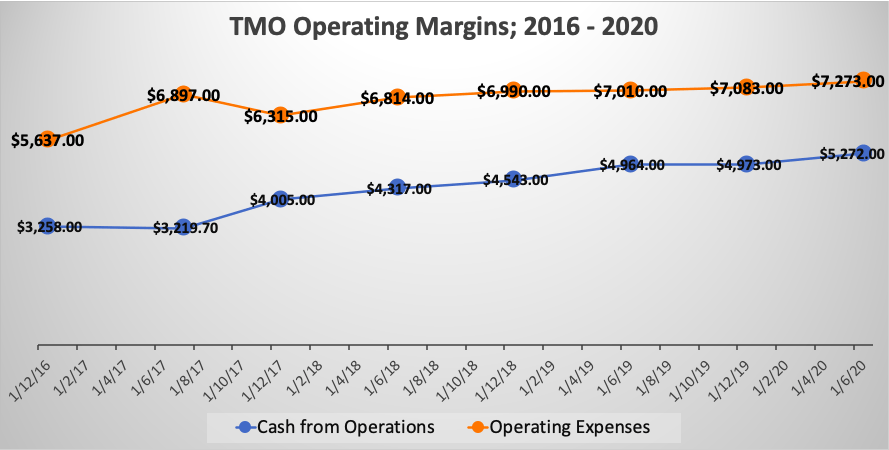
Data Source: Value Line TMO; Author’s Graph
On this growth, EPS has consistently beaten expectations over the previous year, most recently by $1 exactly, which was exceptionally pleasing as a demonstration of value creation for shareholders. Consequently, there have been a total of 15 up revisions for projections into the next quarter.
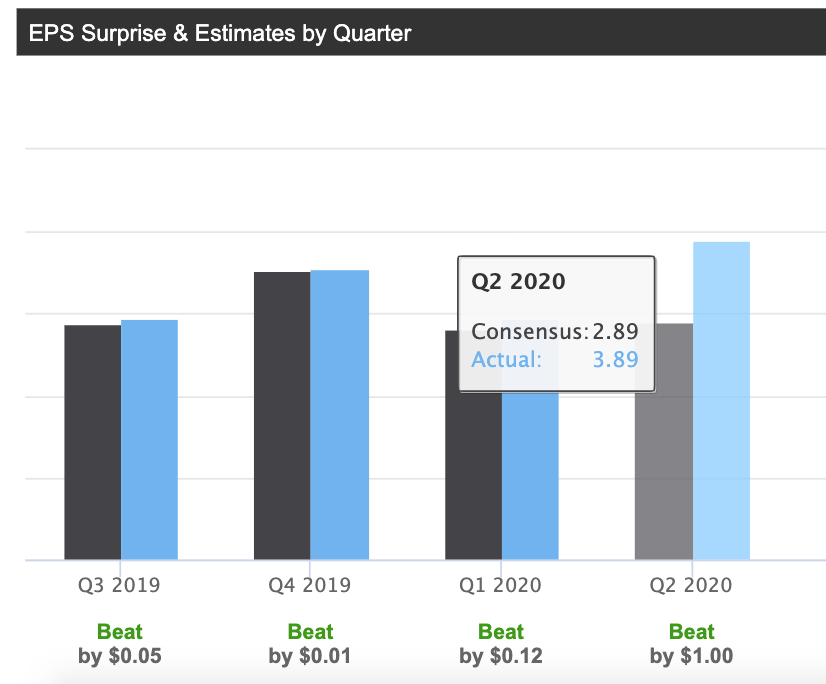
Data Source: Seeking Alpha
Quarterly EPS is expected to increase by 12.7% by Q4 in December this year on annual EPS estimates of $15.01 in the same month. This figure is tipped to increase around 10% each year over the next 3 years, using the same approximation method outlined previously.
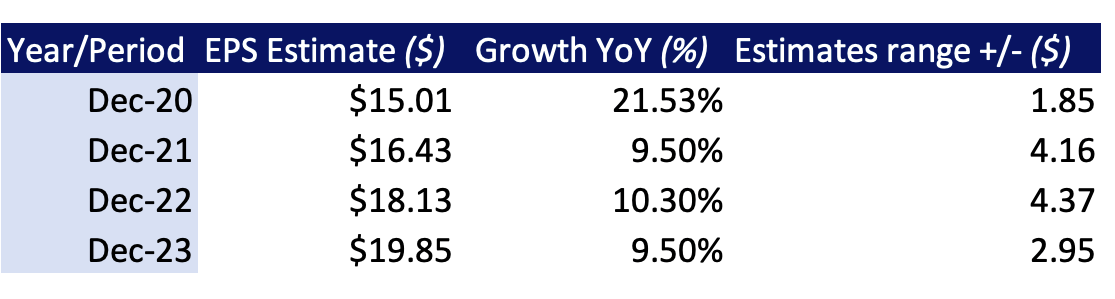
Data Source: Author’s Calculations; Seeking Alpha
The company has demonstrated profitability after meeting its obligations to date with an FCF margin of 16.17% on current FCF of $4.245 billion, available to shareholders through planned dividend increases and to the company by way of additional working capital. At the current speed, FCF is anticipated to climb by over 60% to $5.564 billion by December 21 (using the same estimation method), representing a substantial increase of cash available to shareholders and expanding operations.
Data Source: TMO 10-K; Quarterly Reports; Author’s Tabulation
Data Source: Author’s Calculations; Obtained using linear regression from the consensus of analyst estimates
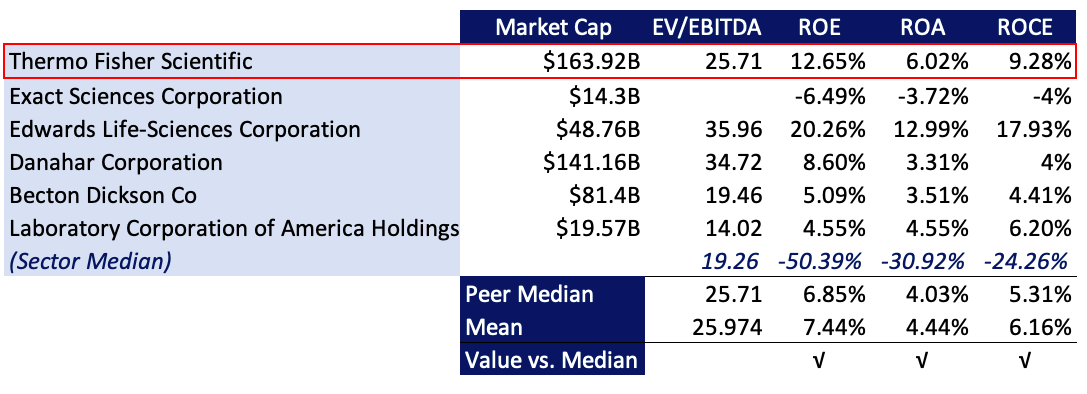
ROE for the TTM was 12.65% for shareholders, well above the industry median of -50.39%. We believe this figure is an accurate reflection of profitability for shareholders, as peer companies with similar profiles to TMO have ROE ranging from -6% to 20% each with smaller market capitalization relative to TMO, and the company has delivered a higher TTM ROE than the median and mean figured from the 5 comparable companies discussed throughout this analysis:
Data Source: Author’s Calculations
As seen, TMO registers higher ROE than all peer companies bar Edwards Lifesciences Corporation (EW) and as seen above. The figure of ~13% for TMO seems sustainable on the back of continued earnings surprises over the last 2 years, beating analyst estimates 8 out of the 8 quarters to date. For Exact Sciences Corporation (EXAS), EV/EBITDA was not recorded as it is a negative score and receives a blank score in the screening.
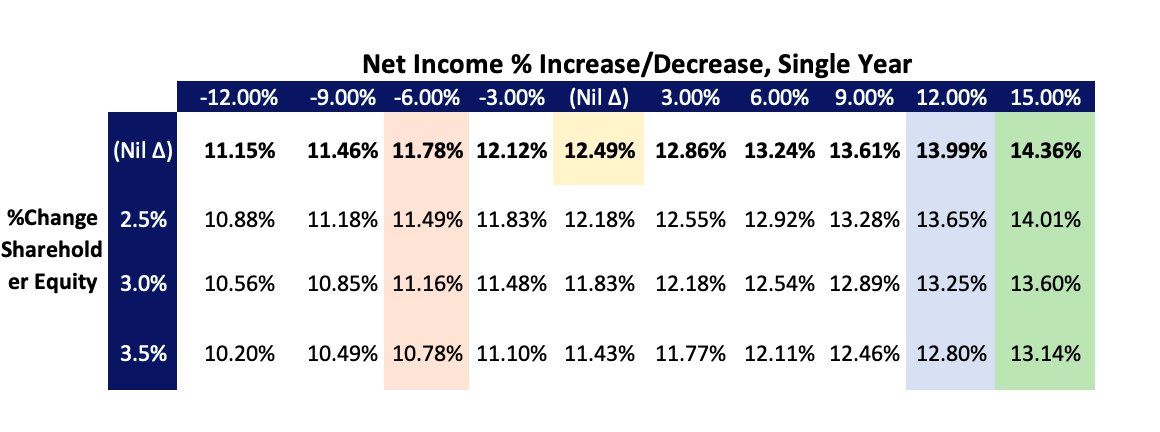
ROE Sensitivity, Base case in blue, upside in green, downside in salmon; current figure in yellow:
Data Source: Author’s Calculations
We see ROE for shareholders potentially suffering if there is a 5-6% reduction in annual net income over the next period, even on the back of conservative estimates for increase in average shareholder equity from the balance sheet. In the base case, we see shareholders benefiting by 1.5-1.87% and the company showing a sustainable FWD growth rate of 13.17%
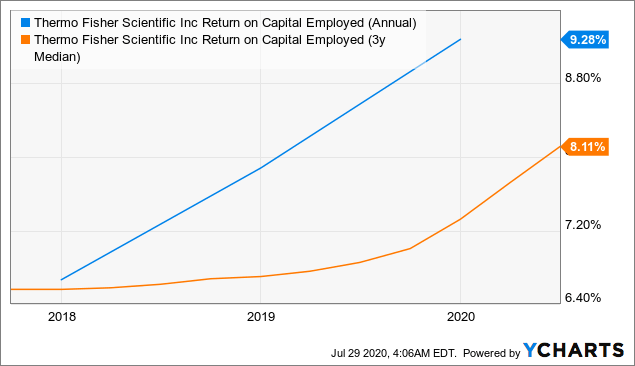
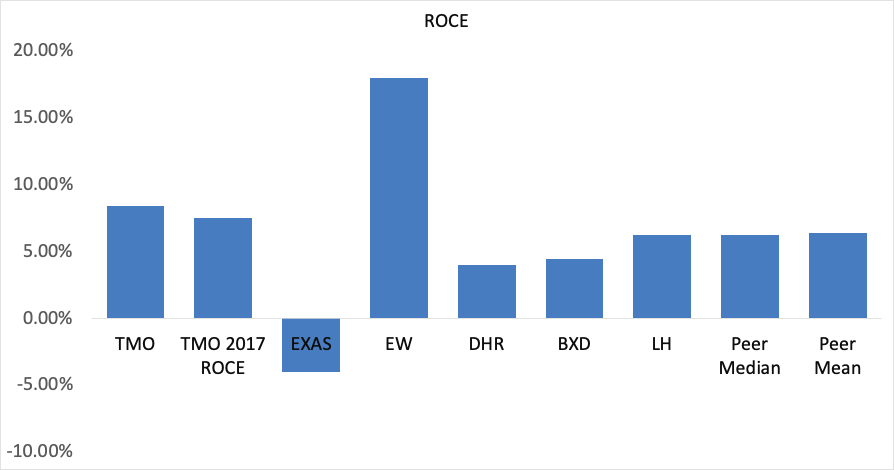
Additionally, the company has shown ROA of 6.02%, turning over 44% for every dollar invested obtained from an asset turnover ratio of 0.44. The ROA figure sits aloft the median figure in the company group and well above the industry median of -31%. On the back of reasonable asset turnover, the company has demonstrated exceptional annual ROCE of 9.28%, up from 7.2% 3 years ago. The change in ROCE is definitely reflected in the share price, valuation increase and total returns delivered to shareholders over this period. In fact, ROCE is a metric that I use to screen for quality in valuation and growth, as many companies which show consistent positive changes to ROCE also register higher valuations and capital gains over time. The mentioned figure sits above the median peer number of 2.2%, and particularly over EXAS by way of example, which has performed poorly over ROCE. However, EW outshines here. Although, at ~18% return on capital, the question arises – is this sustainable? As it may become unrealistic to expect ROCE to continue at that rate; and TMO’s figure is far more realistic from a sustainability perspective to continue to deliver returns; moreover, it gives some room for scale in the absolute figure to grow. Nonetheless, investors should monitor the relative figure of EW closely, as one may find it a better use of investor capital over TMO if these trends continue.
 Data by YCharts
Peer Comparison:
Data Source: Author’s Calculations
Dividend Coverage and Solvency
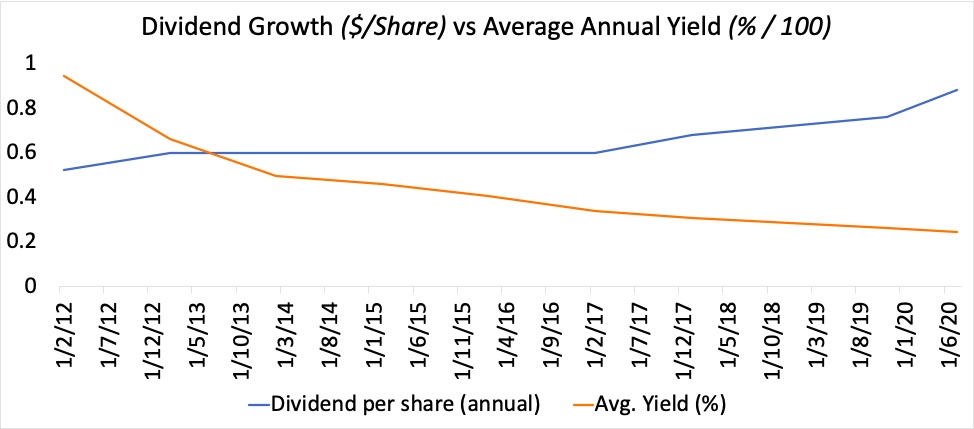
From its most recent payout, the company returned around $85 million in dividends, mirroring a 16% increase which the company has committed to fulfilling over 2020. TMO shareholders have realised ongoing dividend gains since 2012 with demonstrated CAGR of 4.84% in payouts over the 3-year period to date. Current yield is 0.22%, below comparables Danaher Corporation (DHR) at 0.36% and alongside Becton, Dickinson and Company’s (NYSE:BDX) 1.15% yield and thus does not seem overly attractive, being in the 25th percentile over US dividend paying companies. However, considering this is relatively early days in dividend payouts for the company, long-term players will benefit from commitment to ongoing payout expansion into the future at the current entry dividend (annual) of $0.88/share forecasted for 2020. Most recently, the company fulfilled its Q2 dividend of 22 cents/share on the back of favourable earnings growth previously outlined, and the current trajectory looks to satisfy ongoing growth of payouts into the future.
Data Source: Value Line TMO; Author’s Calculations
On a payout ratio of 5.86%, this is extremely sustainable in light of FCF and net income for the year, thus coverage remains well splayed from the perspective of FCF and net income at 38.5x and 13.24x coverage respectively on the current DPS figure. Payout ratio also has wiggle room for scale, thus incentivising current and future shareholders. Dividend growth is estimated at 6.8% over FY2021, with 7.5% growth forecasted the year after, to show example (obtained using regression analysis from consensus of reviewed analyst estimates). FWD coverage is therefore well matched on this DPS growth at 9x from FCF and 3.09x current net income. Total return investors should, therefore, see the upside case here, particularly on the back of the sales and growth ratios for the company previously outlined.
Data Source: Value Line TMO; Author’s Calculations
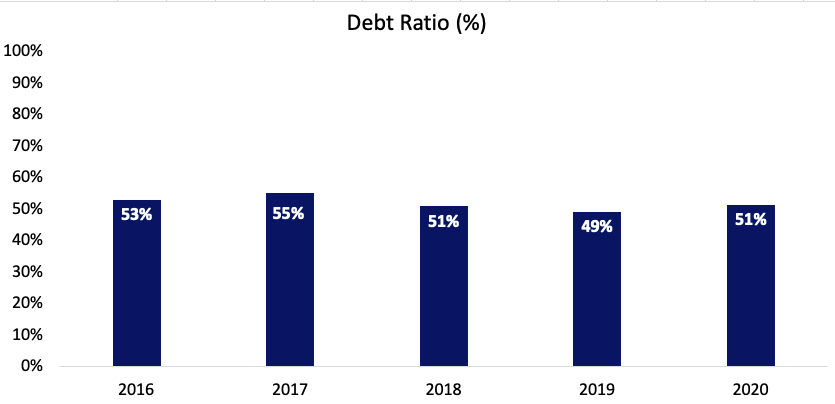
The company finished the quarter in a well capitalized position having exited with cash and equivalents of $5.82 billion, expanded from around $3 billion over one year ago. From a solvency perspective, the company is well positioned and has adequate interest coverage moving into 2021. Interest payments are covered by earnings at 10.56x for the quarter and annually by 8.18x the EBIT total. Total debt is well managed by the asset base with every dollar of assets carrying ~50 cents in debt, which has been consistent over the previous 4-5 annual periods. This is pleasing to see and evidences the leaderships’ competency over debt management. These figures also show investors the company’s capacity to generate additional return on capital. With fewer dollars attributed to the current portion of long-term debt, after leveraging up for participating in acquisition activity, this cash can materialise as re-investable working capital alongside research and development funding.
Data Source: TMO 10-K; Quarterly Reports, Author’s Calculations
In March, the company issued notes to primary claimants under the THERMO FISH.20/25 title on volume of 1,100,000,000 issues, paying a coupon of 4.133% (on regular interest) and maturing in 2025. The bond is not a floater and is due to make semiannual payments over this time period. The next coupon date is for September of this year, thus additional management over interest coupon payments is required to satisfy bondholders and other non-residual claimants and to retain adequate liquidity in the firm for operations and obligations. However, the firm is positioned to fulfil its obligations here.
TMO Current Position (Annual):
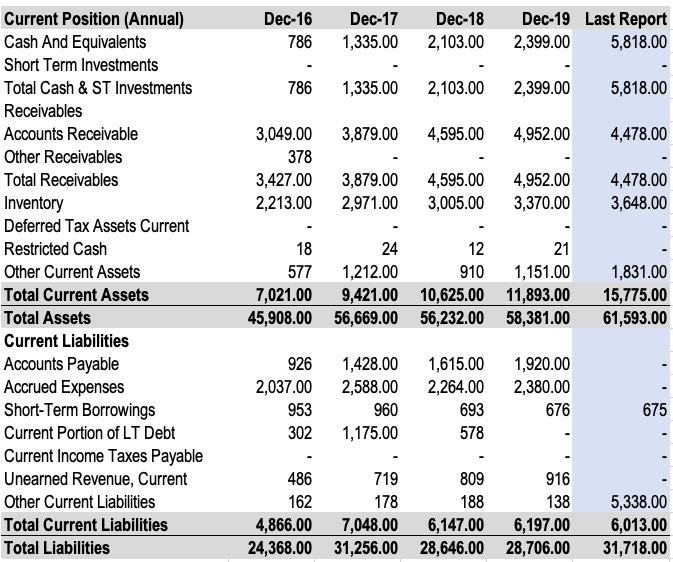
Data Source: TMO 10-K; Quarterly Reports; Author’s Tabulation
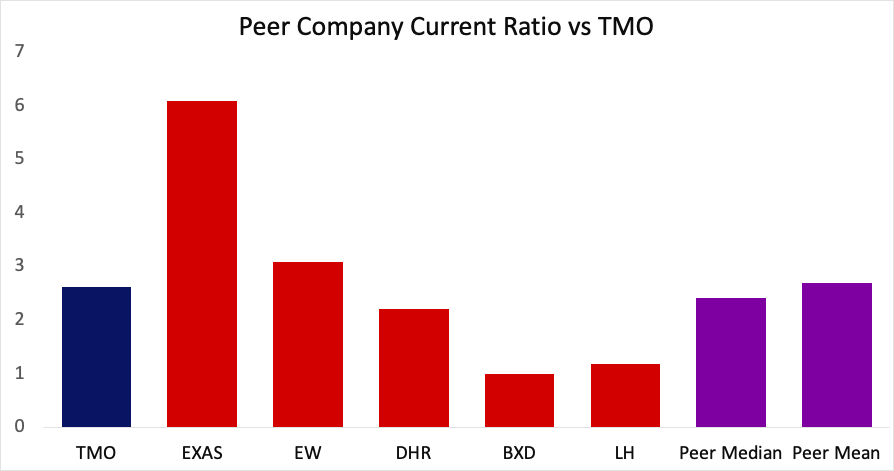
Extending on the solvency basis, short-term obligations are also well covered with a current ratio of 2.62x, evidencing the company’s capacity to meet its short-term commitments as they fall due. The company holds $3.648 billion in inventory as per the last report, which is not out of line from older filings, and thus, the company seems to be managing its inventory well, and performing an acid-test over short-term solvency, the company holds a quick ratio of 1.71x if unable to sell inventory quickly. This is in contrast to BDX and Laboratory Corporation of America Holdings (NYSE:LH) which seem to elicit a shortfall in this domain with current position of 0.98x and 1.18x, respectively. Thus, in this frame, TMO is well positioned on the back of these factors, propping the buy case as default risk and drains on liquidity seem unlikely, thus permitting shareholders to gain on the back of the company growth strategy.
TMO current position (Quarterly):
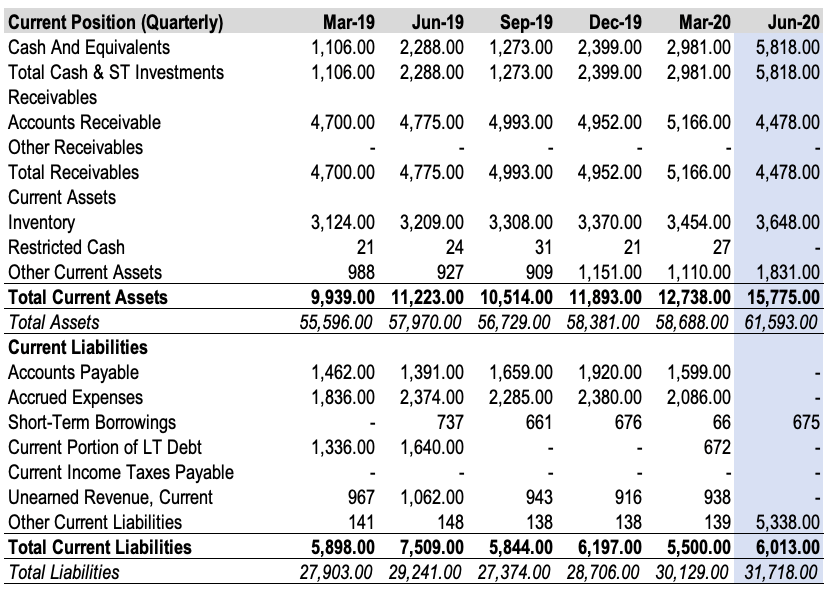
Data Source: TMO 10-K; Quarterly Reports; Author’s Tabulation
Data Source: Author’s Calculations
Growth Catalysts
TMO has many catalysts for continued growth, adding weight to our case. The Protein-Binding Assay market is poised for ongoing expansion and is projected to reach around US$425 million in 2023 on a CAGR of 10.7% over this period. TMO is a major player in this market and focuses on developing partnerships through collaboration and license agreements, ultimately strengthening their position within the market segment. TMO is successful in drug discovery, reducing development costs and growing R&D expenditure within this segment.
Furthermore, in January of this year, TMO and LH entered an agreement that would permit LH to utilise TMO’s patented “Next-Generation Sequencing System (NGSS) alongside the R&D rights to their Pan-Cancer Assay technology, which is a complete solution to detect multiple targets in tumour examination and treatments.
This particular platform is an exceptional innovation that delivers accurate results within the period of a single day; however, it is not for use in the general public – it is for research and development purposes only, therefore, TMO benefits greatly on the back of higher margins that can be charged to research cliental. The exciting aspect is if it gets approved for diagnostics and results are extrapolated to the general public where it can reach critical mass. That is a multi-billion dollar opportunity in itself as TMO will capture market share quickly on this platform.
Additionally, TMO has been busy with acquisition and collaborative activity this year, such as in February where they announced a collaboration with NanoPin, to develop diagnostics for blood born infectious diseases. NanoPin will ride on the back of this technology to hopefully produce assays for these particular types of conditions, the aim of which is to speed diagnostic and results wait times. TMO’s position here allows it to pioneer the reduction in wait times for critical results for clinicians and patients alike.
As well, the company has entered into a partnership with the company Q-linea who are from Sweden. This procurement grants Q-linea exclusivity in the monetisation of the system ASTar, which is a unique system that helps deliver rapid test results for patients in critical care whom are suffering from dangerous infectious diseases, COVID-19 included. TMO benefits here from repeated sales and the licensing structure, in stability and predictability in revenues for example, especially as particular markets within the segment are growing at around 10% CAGR annually.
Data Source: Hospice Medica
Additionally, there are many coronavirus-related catalysts, which is peculiar but nothing short of fantastic for TMO. Genetic Technologies (GENE) has started its first purchases of the panel of tests that are a part of the COVID-19 test that Thermo has pioneered this year, for instance.
From the company’s end, they have maintained operations through a 3-pillared approach that has enabled the continuation of financial gain this year, such as including numerous health and safety protocols at its sites alongside medical personnel who are able to offer counsel and service to management. In addition, it has maintained its business to match global COVID-19 related consumption in medical and safety supplies. Consequently, the company has had minimal disruption over its supply and integration chain.
The entity is also is focused on delivering on its long-term vision for growth, by capitalising on growth in existing markets and growing relationships with purveyors to add rungs into the supply chain. To demonstrate, the company has very recently released two new “Orbitrap Exploris” medical instruments which shall assist in the advancement a segment known as biotherapeutic research. From the company’s end, these moves evidence leadership’s ability to continue to grow and capitalise their existing markets whilst generating new forms of income.
As mentioned, the company has continued to facilitate global demand for COVID-19 related products and, as such, ramped up its production of the diagnostic tests that will assist clinicians to diagnose coronavirus in symptomatic and asymptomatic patients. This is achieved through a complex testing protocol that is able to detect nucleic acid specifically pertaining to the COVID-19 pathogen. The company is pushing for its attainment in Europe also.
The company noted very recently from the end of Q2 that capacity is high enough to produce and dispense more than 10 million of these tests each week. Furthermore, in terms of the development of therapeutics and vaccines, Thermo Fisher is partnering with a number of biotechnology clients who are concurrently working towards unification in COVID-19 related products and research and is currently working on more than 200 COVID-related projects globally. As such, the pharmaceutical arm of the company is presently working towards the production of medicines that are reportedly demonstrating some effectiveness in treating the COVID-19 pathogen in humans.
Moreover, as part of its vision for growth and generating effective return on capital, TMO has been busy with acquisition and collaborative activity this year. The company has recently completed a deal to acquire QIAGEN (NYSE:QGEN) which is a leader in molecular biogenics, which will be a parallel fit to the company’s existing operations. This deal undoubtedly will also enhance cash value towards shareholders coming out of 2020. In fact, such is the perceived success of this acquisition, that immediately following the deal, Moody’s reaffirmed the company’s Baa1 senior unsecured credit ratings on the back of consistent competency in debt management having leveraged up over this period of acquisition activity.
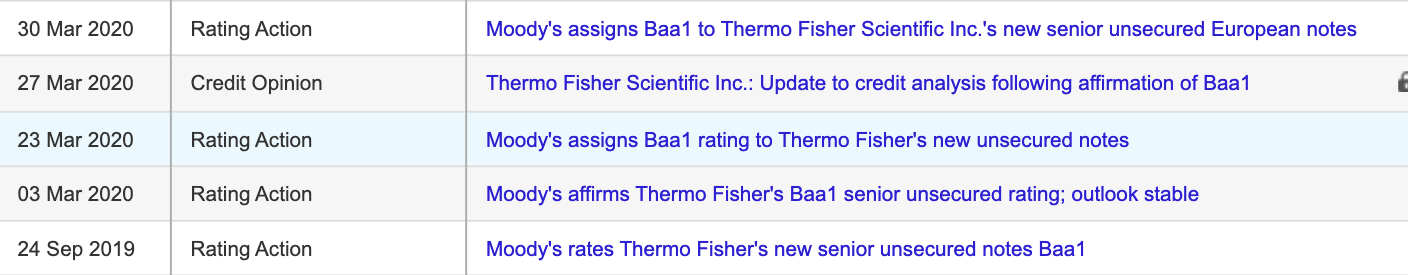
Data Source: Moody’s Investor Service
Perhaps equally as satisfying is the increased coverage over emerging markets, which the company has mentioned to be a key competitive advantage that has secured a high amount of quality accounts. As TMO continues to scale their operations in existing markets, it plans to increase its visibility in large APAC nations in particular India and China, and to extrapolate these markets into other regions such as Brazil, for instance.
Valuation
Market participants have shown support in numbers from March until date. Subsequently, the price has rallied to its all-time highs this month of July. This show of support has bolstered the valuation and on current trends seems as if the trajectory will have legs for the remainder of FY2020.
 Data by YCharts
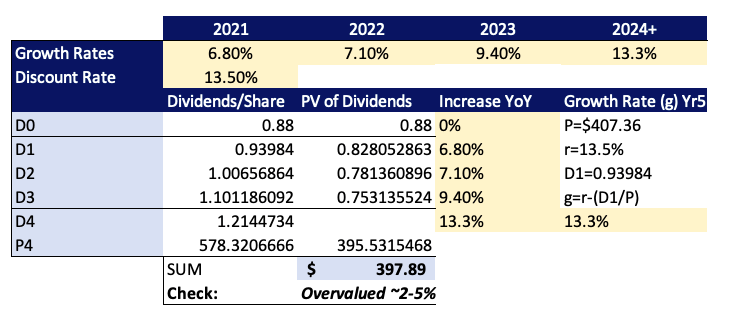
The company has been paying dividends since 2012, thus we feel it is appropriate to utilise a 2 stage dividend-discount model to support our valuation case. In TMO’s case, we see high periods of super-normal growth over the next 3 years at minimum and confer with analyst that there will be a dividend increases for this period. We have arrived at a required rate of return figure of 13.5% by summing the opportunity cost of holding the S&P 500 index and the risk-free rate, using the 10-year expected (mean) return and the current 10-year treasury yield as the proxy. This figure is preferred in our opinion over the equity risk premium at this point, considering high uncertainty within equities markets at present. Growth estimates are obtained from performing linear regression of the consensus of analyst estimates and have estimated the growth rate to perpetuity using the Gordon Growth formula and arrived at a figure of 13.3% to determine a terminal value of $395.53.
2-stage dividend discount model:
Data Source: Author’s Calculations
From our inputs, we see the intrinsic value as overvalued by 2-5% (on the quoted share price at time of writing) on an intrinsic value of ~$398. This figure will be watched closely over the coming weeks and months, utilising the same inputs for TMO and similar companies for comparison. Our scenarios on the DDM are outlined below, and we observe a sizable downplay in valuation to undervalued territory with a 0.10% increase in our estimated perpetual growth rate for dividends. In this view, the premium placed on the market price is supported by fundamentals and market considerations discussed earlier.
Sensitivity Analysis: Intrinsic Valuation; base case in blue, downside in salmon, upside in green:
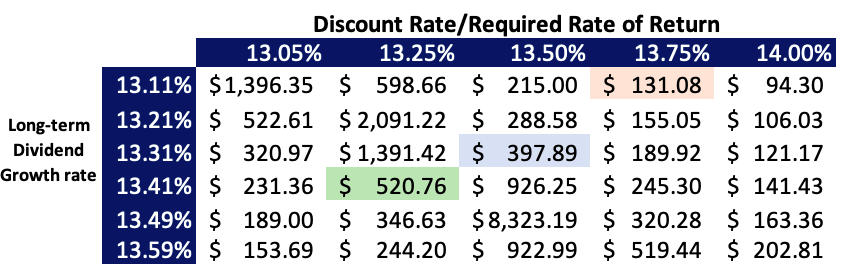
Data Source: Author’s Calculations
Additionally, we have added weight to the valuation with analysis over FCFE, using FCFE estimates that are obtained using linear regression of the consensus of analyst estimates over the coming 5-year period. We have utilised the PRAT model to obtain estimates for the sustainable growth figure of 9.70%, to arrive at a fair value of $427.96. See below:
| Figure | Source | |
| Sustainable Growth Rate (PRAT Model) | 9.70% | Company Filings, Author’s Calculations |
| Discount rate/required rate of return | 13.50% | Opportunity Cost S&P 500 + 30 US Treasury Yield |
| Year ending | FCFE Estimates | PV of FCFE |
| 2021 | $5,563.55 | 4,901.80 |
| 2022 | $6,462.92 | 5,016.91 |
| 2023 | $7,518 | 6,623.79 |
| 2024 | $8,299.25 | 7,312.11 |
| 2025 | $8,958.23 | 7,892.71 |
| Terminal Value Year 2025 | $258,609.95 | |
| PV of TV | 137,298.5441 | |
| SUM | 169,045.8856 | |
| Equity Value | $427.96 |
On this analysis, we see the equity value as undervalued relative to the current trading price (at time of writing) thus, in unison with the DDM above, we firmly believe the stock is fairly priced in the trading ranges of $395-$430, which we feel the company shall meet within the next few months at its current trajectory. An average of the two DCF metrics gives a figure of $412.93, which is about right in our view. Additional cases are observed below, most notably a sizable increase in equity value on a 1% increase in the sustainable growth rate, illustrating where the valuation is most sensitive to changes in long-term growth of FCFE.
Sensitivity: FCFE Equity Value; Base case in blue, upside case in salmon, upside case in green
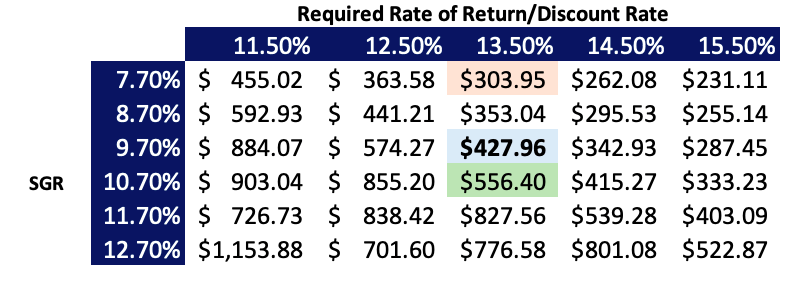
Data Source: Author’s Calculations
The company trades at a premium TTM P/E of 43.99x aloft the industry multiple of 36.39x; however, it is well positioned relative to the peer entities median of 61.59x. This is pleasing for TMO, as it exemplifies value on this front; as many high P/E companies within the S&P 500 (SP500) have shown 30-50% growth at high valuations this year, TMO, in this case, demonstrates equally as satisfying growth albeit at a far more respectable P/E valuation than Amazon (AMZN) at ~150x, by way of example.
Furthermore, the market values the company on a P/Sales front ahead of the industry and peer median in this case, at a ratio of 6.16 vs 6.43 and 6.215, respectively. Additionally, from a price-earnings growth front, TMO shines again, although is expensive compared to the industry. This, alongside the comparable P/E figure, demonstrates the premium market participants are willing to pay on the back of demonstrated results and upcoming expectations from the company, rather than seeming out of sync with valuation. You get what you pay for, especially for equities at the moment.
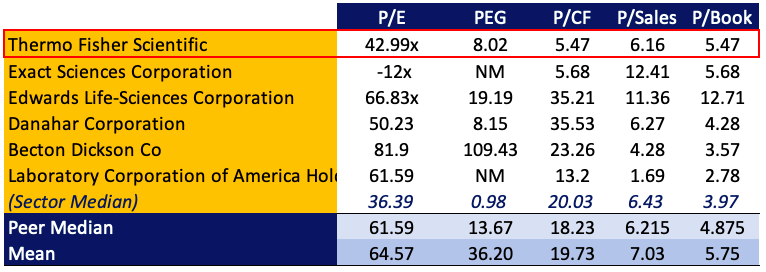
Data Source: Value Line; Author’s Calculations
TMO therefore screams value here, albeit at a slight premium, by our best estimation, the company will continue to ride up and at these metrics and clearly outshines some of its competitors to navigate the horizon moving forward.
Risks
There are risks to the company and to shareholders. In our downside case scenario, we see that if the company cannot perform at the sustainable growth rate and is to underperform by only 0.10% from our estimates, then the intrinsic value will likely show that the stock is highly overvalued by an additional 51.1%. If we are incorrect in the discount rate applied, and it were to slightly increase in combination, this would blow to over 70% overvalued. We are confident in our calculations relative to other estimates to mitigate this point. The sensitivity to dividend growth in this model demonstrates the risks shareholders face at the current share price and must be closely watched, particularly leading up to Q4 guidance. Therefore, a medium to long-term horizon is preferred to capture gains on the back of company performance, rather than valuation alone.
Additionally, if our input assumptions are correct on FCFE valuation, then we see a 1% dip in sustainable FCFE growth as a 71% overvaluation on equity value. This is certainly an unfavourable impact on valuation. However, the company is poised to perform well on an FCFE basis by all estimations.
Additionally, there has been around 3-5% downside risk in price returns over the 1-3 year period. Maximum drawdown on price from May of this year has settled around 25%, which has been pleasing on the back of the price rally that has occurred over the previous few months, but above-average returns may bring volatility and expand on this previous drawdown.
For the company, sales have taken an impact particularly on surgical/medical supplies, as the majority of elective surgeries and procedures have been cancelled amidst the pandemic. There is no saying when these will resume, and thus, uncertainty in these accounts has arisen for TMO. Furthermore, the company’s industrial end markets recorded a ~10% decrease, whilst their accounts were negatively affected on a growth front by 20% decrease in customer sales. Customers in these two end markets were significantly affected by business disruptions due to the pandemic. As the company also participates in several global markets, it faces foreign exchange risks associated with its global accounts, thus shifting the carryon costs of hedging positions designed to dampen these effects. Hedging costs may increase too on the back of the weakening US dollar and uncertainty with key state relationships, such as China.
Conclusion
The case for a buy on value and growth has been made clear in this piece. Potential shareholders will benefit at the current entry price, although high, considering the company’s directive out of 2020 into the post-pandemic society. We feel the company is well positioned to adhere to the at least the base case in our scenario, and even if we are wrong in two out of the three scenarios, the company is still poised to perform on other additional fronts, separate from intrinsic value. On the analysis of comparables, TMO outperforms the median figures of the industry in enough of the metrics to bolster the valuation and the case for entry. Long TMO for 2021.
Disclosure: I am/we are long TMO. I wrote this article myself, and it expresses my own opinions. I am not receiving compensation for it (other than from Seeking Alpha). I have no business relationship with any company whose stock is mentioned in this article.
