
Vertex (VRTX), the inventor of the new cystic fibrosis wonder drug Trikafta, is a shining star amongst biotech and pharmaceuticals for 2020. On a background of strong fundamentals, with forecasted EBITDA growth of 51.29% in the coming year just to name a few, investors have demonstrated an expectation of extraordinary results into the coming periods. Thus, a compelling investment case is made for medium-term players to capture fantastic returns over the next multiple periods, which is summarised below.
Profitability
The company has delivered CAGR revenue of 33.65% over the previous 3 years and a mammoth 47.60% revenue growth in the single-year period to date, on a gross margin of 48.57%. The latter figure arose largely on the back of Trikafta’s approval in the USA back in 2019 which generated $420 million in sales in Q4 2019 and shall continue to accelerate earnings into 2020/2021, with revenue guidance of ~15% or $6.62 billion estimated in 2021.

Data Source: Vertex 10-K Filing 2019; 2018; 2017; 2016; 2015
Such growth in revenues and earnings positions the company exceptionally well from a solvency and operations perspective. As such, the company has no long-term debt on the balance sheet and will continue to meet its short-term obligations as they fall due moving forward, with a current ratio of 3.27x, which also demonstrates that every 1 dollar of short-term liabilities is covered by $3.27 in current assets.
VRTX Current Position:
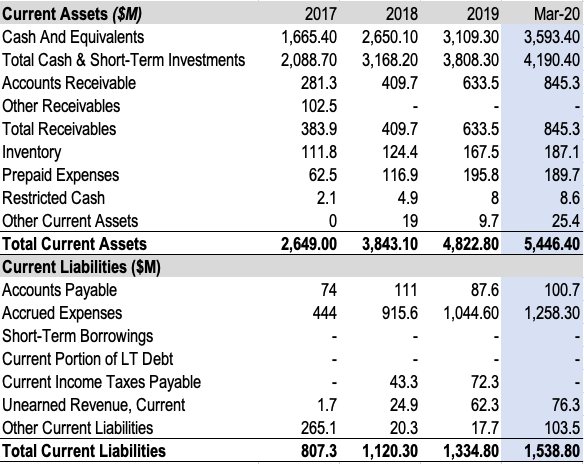
Data Source: Vertex 10-K Filing 2019; Vertex Quarterly Report March 2020; Authors Calculations
Furthermore, VRTX shows profitability after already meeting its obligations leaving FCF of $1.33 billion on a FCF margin of 27.6%, well above the sector median of -2.21%. This is coupled with operating cash flow of $2.06 billion giving an OCF margin of 42.7%; on operating expenses of $182.30 million, down roughly 6% from December 2019.
Pleasingly, Vertex has delivered quality ROA of 13.34%, ahead of competitor Regeneron Pharmaceuticals (REGN) at 10.77%, by way of example. Superior ROE is also observed in TTM ROE of 27% for Vertex shareholders, and trumps the industry median figure of -50.5% and also sits aloft REGN’s ROE figure of 21.13%. Equally as satisfying is to see consistency in asset turnover, most recently at 0.62, showing the company generates 62 cents for every dollar of assets on the books.
Excess returns can be also be attributed to positive changes in ROCE in the case of Vertex over pure accounting factors, which has demonstrated a move in unison with the stock price. Return on capital employed is a metric contrarian investors such as myself may use to screen for quality in valuation and growth. VRTX has demonstrated 22.5% TTM ROCE, up from 12.5% 3 years ago. These figures are reflected in the price returns shareholders have enjoyed over the same periods. In fact, many companies that show consistent changes in return on capital also register higher valuation over the mid to long term. Bill Miller’s success in charge of the Legg Mason Value Trust was attributed to this very point, for example. Put simply, relying on true “value” indicators alone is subject to a poorer screening strategy as low valuation companies can regularly show low value metrics with equally low ROCE. Consequently, Vertex has shone in this regard, with higher ROCE over peer entity REGN who have managed 18% return on capital, to demonstrate. The case for entry at the current price is further lifted on this sentiment.
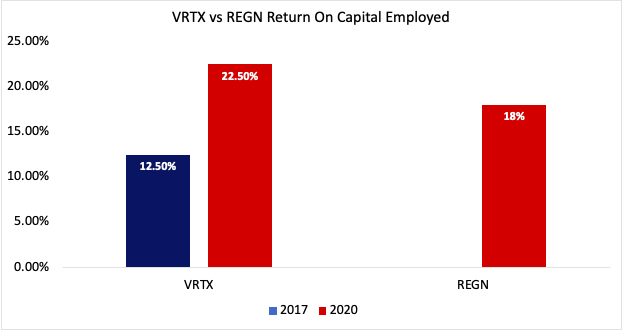
Data Source: Valueline VRTX; Authors Calculations
Vertex has also delivered above expected EPS most recently posting $2.61 per share, beating analysts’ estimates by 70 cents in April this year. Analysts estimate the EPS figure to expand in a range of $7 – $8.82 into next year. The entity has continuously beaten analyst estimates on EPS and other figures, which has proven to be an underlying driver in price returns.
Data Source: YahooFinance VRTX
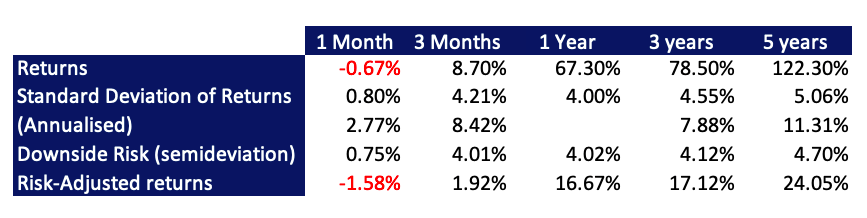
Shareholders have enjoyed returns of ~67% over the single-year period to date, beating the market by 58% on 4.02% risk to the downside in the same period. This presents a compelling case for investors. Additionally, volatility has been stable in the 3-month to 5-year analysis period showing standard deviation of 8-11% (annualised) in this date range, with downside risk in the range of 4.21-5.06%. By comparison, the S&P Pharmaceuticals Select Industry index (SPSIPH) has shown around 25% of volatility defined as a function of standard deviation during this period.
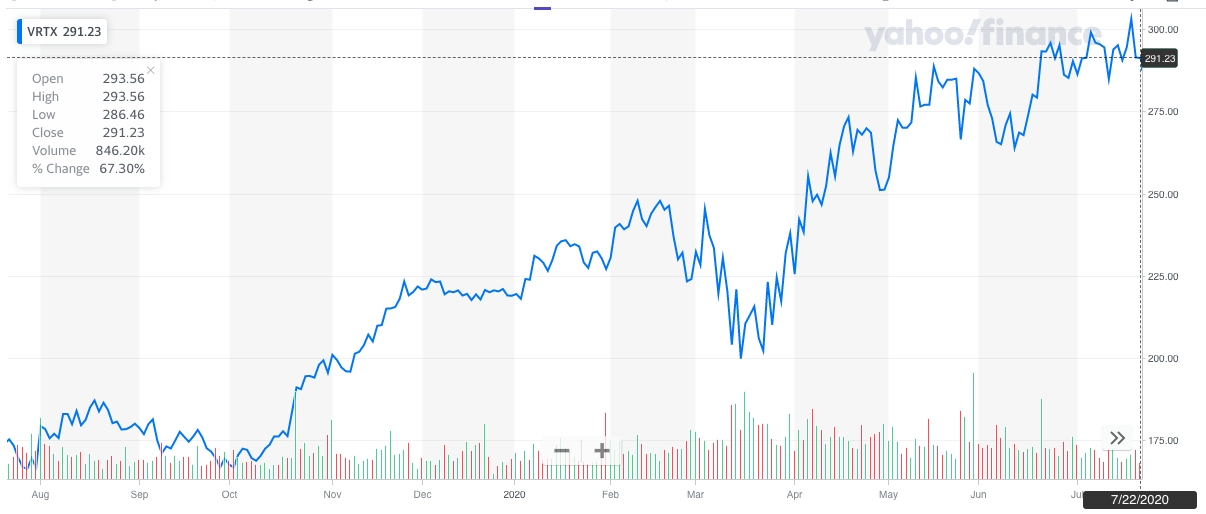
In view of this, one can clearly observe the upside here, especially considering the figures over the 3-year period. Historical figures are obviously not a guarantee for future performance, which is why the upside case is bolstered by VRTX’s outstanding profitability and liquidity position alongside strong fundamental momentum, particularly in light of the market turmoil investors have experienced over the course of 2020 to date.
VRTX Historical Price Information:
Data Source: Authors Calculations
Valuation
The stock trades at a premium over the industry P/E with TTM P/E of 50.40x as compared to the industry median multiple of 36.61x. REGN trades closer to the industry figure at 32.02x, however, investors shouldn’t place overvalued status on the stock just yet. For example, high P/E stocks within the S&P 500 have returned over 30% on average this year while seeming overvalued compared to the index. Additionally, the P/E figure demonstrates the premium investors are willing to pay for earnings, justified on the company’s end by superior performance in sales growth, price returns, and other valuation metrics. Moreover, FWD P/E is poised to fall around the 40x multiple mark from analyst estimates.
Therefore, price-to-cash flow may be a better valuation metric, by factoring in true cash values over earnings. Vertex has a P/CF of 36.65 which sits marginally above REGN’s figure of 29.02 but is again bolstered by above average returns and company performance over the period to date. More so on beating median analyst price targets of $267 earlier this year. On a Price-to-Sales front, the market has valued VRTX at $15.58 per dollar of sales, likely on the expectation of continued revenue growth.
Because the company holds no long-term debt, EV/EBITDA may not provide an accurate snapshot on absolute terms and relative to peer companies. Instead, analysis of P/FCF allows for a more consistent valuation metric in this case and Vertex registers a healthy multiple of 5.68, not out of sync with REGN at 5.05; illustrating the company’s share price is likely fairly priced relative to free cash flow. Vertex’s figure here also evidences the company’s position to generate additional revenues into the future. To strengthen the case of FCF valuation, one can analyse FCFE, discounting forward FCFE figures obtained using linear regression from the consensus of analyst estimates, as shown below.
Using this method, I have included the opportunity cost of holding the S&P 500 index as the proxy instead of the equity risk premium (6.00%). I have incorporated the index 10-year mean return as the proxy figure, as the equity premium may be inaccurate amidst high levels of market uncertainty. Considering the growth estimates and track record of the company, forecasting risk is dampened and estimates out to 10 years are used.
| Risk-Free Rate | 10-Year USA Government note yield | 0.006 |
| Opportunity Cost | 10-year expected ((mean)) return S&P 500 index | 0.141 |
| Discount Rate Applied for DCF | = risk-free rate + opportunity cost of holding S&P 500 index | 0.1469 |
| FCFE ($M) | Analyst estimates (see below) | |
| Shares Outstanding | Market Data | 259 million |
| Est. Horizon Value in 10 Years | Compounded @ stock price 5-year CAGR (15.06%) | $1,154.95 |
Data Sources: Bloomberg Treasury Yields; S&P Global Indices; YahooFinance VRTX; Authors Calculations; Valueline VRTX
| Year | FCFE estimate | PV at discount rate |
| 2021 | $3,115 | $2716 |
| 2022 | $4,063.5 | $3089.2 |
| 2023 | $4,922.5 | $3262.9 |
| 2024 | $5540.5 | $3144.4 |
| 2025 | $5995 | $3021 |
| 2026 | $6382.3 | $2804.30 |
| 2027 | $6712.5 | $2571.61 |
| 2028 | $7000 | $2338.26 |
| 2029 | $7256.9 | $2113.59 |
| 2030 | $7491.5 | $1902.45 |
| 2030 | PV of sale price year 10 | $293.29 |
| SUM | =$26,964 | |
| EV per share | $104.11 | |
| Intrinsic Value | =104.11+293.29 = $397.41 |
Data Source: Authors Calculations
The stock appears undervalued on an estimated intrinsic value of $397.41, trading at market value of $283.95 (at the time of writing) from this analysis, adding weight to the investment case. On a growth front, FWD PEG ratio is estimated at a multiple 1.40x, illustrating how the company’s lofty P/E ratio reflects promising growth prospects moving forward, in line with market expectations. Therefore, medium-term players can use the above data in addition to alternate coverage of the company to make an informed decision prior to investment into the stock.
Further Considerations
The COVID-19 pandemic should have little negative impact on the company’s estimates as management have confirmed the earnings outlook for 2020 and continuation in supply for its medicine line. With planned EBITDA growth of 51% in the coming year, Vertex will aim to capture additional market share and increase market capitalisation accordingly. Trikafta is poised to continue its sales trajectory as a leading innovation in the cystic fibrosis community, as it reportedly can assist up to 90% of patients with the condition. Management have also hinted at future works in the pipeline to diversify away from cystic fibrosis, as well, thus reducing the threat from gene-editing technologies that look to also treat CF and from peer entities.
Additionally, the product line is in a domain that shows no threat from online retail or e-commerce competition and is in an arguably defensive sector, meaning it can weather the economic fallout in 2020 aloft entities in notable cyclical sectors. This comes as essential information for potential shareholders who will fly to quality as weaker firms are weeded out over the medium to long term.
Risks
Vertex itself faces execution risk in failed R&D on exterior drug synthesis for conditions outside of cystic fibrosis. Whilst the company has pointed at diversifying into additional drug markets, there is no saying that they can successfully discover and produce a scalable solution to additional complex medical conditions, such as Duchenne Muscular Dystrophy (DMD) or Beta Thalassemia (BT), as outlined by the company in Q4 2019. If the results cannot be extrapolated to these patient groups, then there is additional risk of value erosion in stock price and return on capital & thus price value to shareholders.
In the case of these mentioned conditions, the first clinical data on BT was assigned in Q4 2019, while the company has been busy in acquisition activity with Exonics Therapeutics in June of 2019 on an announced CRISPR venture to discover a procedure that would potentially restore the muscle fibre protein dystrophin in patients with DMD. Such advancements are incredibly optimistic, require large funding facilities and as mentioned, there are certainly no guarantees of success in the domain. However, if successful, then there is a minimum $5 billion opportunity in the blood disorders market alone.
On this, competition is farce within gene-editing space; thus Vertex may suffer greatly if other gene-editing research companies – such as Fate Therapeutics (FATE) – arrive at a solution to the same disorders more efficiently and effectively, potentially eliminating reliance on drug therapy for the complex blood and genetic disorders Vertex seeks to medicate. Threats are significantly offset here due to Vertex’s alliance with CRISPR who is undoubtedly the market leader in this domain by a clear mile.
Furthermore, on the back of hefty sales of the wonder-drug Trikafta, any disruption to sales trajectory of this product will hurt the top of VRTX’s income statement. Although unlikely considering the implications to the patient group, the above statement resonates with shareholders who will observe for continued growth in numbers of this product.
For shareholders, in light of the potential “second wave” in respect to the novel Coronavirus, there exist chances of an additional market sell-off for US equities as occurred previously in 2020. What is concerning is the current level of cases seen globally, which paints an ugly picture for all market participants as the current market rally may finally run out of legs. Historical downside risk in share price has hovered around the 4-5% mark, however, if the share price suffers a 5% loss month on end for the next 4 months then risk to the downside expands to 12.46% and may erode the initial investment outlay, thus must be factored in prior to any decision. This represents the part of the downside case for me.
On a valuation front, a 10% decrease in forward CAGR will likely result in a corresponding 3% drop in intrinsic value. While on the other side of the coin, increase in historical growth of 5% may push fair value figure(s) in the same direction by roughly 0.75%. Therefore, intrinsic value may be more sensitive to the downside which, for value investors, is critical in one’s analysis considering the current investment client. Therefore, on a fair value front, the company needs consistent expansion in returns to override the sensitivity in valuation to changes in price returns.
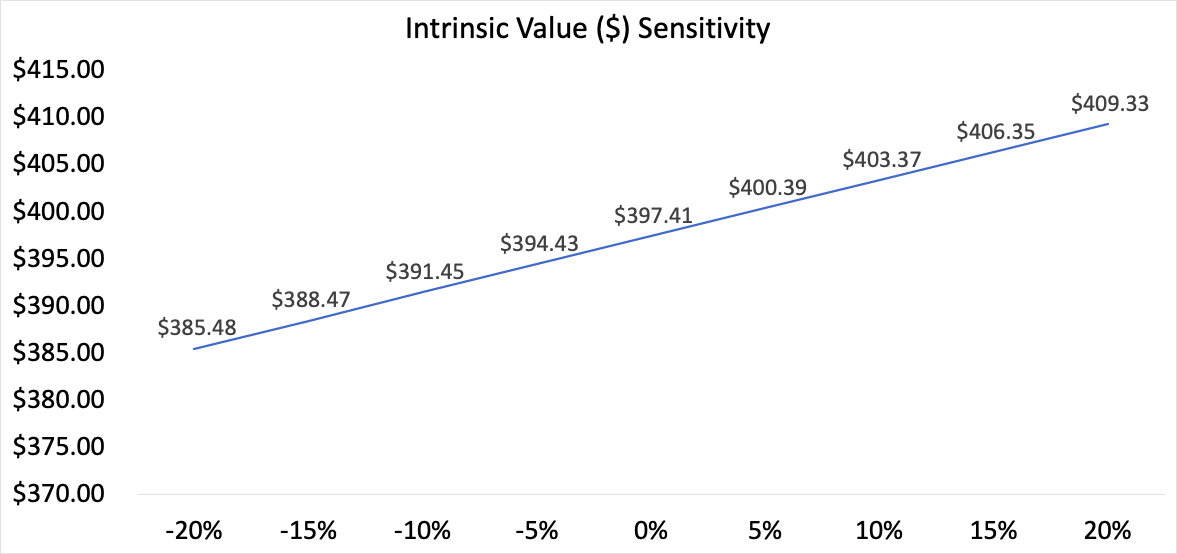
Data Source: Authors Calculations
Conclusion
In the context of the current market climate, Vertex certainly resonates on a value front. The case has been made for medium-term players at the current entry point, with exciting works in the pipeline alongside accelerated, sustainable earnings guidance from the company’s end; and excellent valuation metrics for shareholders in on the back of these expectations. One should also continue to observe return on capital in light of the planned research projects that are aligned with CRISPR technologies, which, for society as a whole has the potential to generate massive inroads and equally as large earnings for the company. These factors in addition to the pointers outlined in this article, make for a solid investment case over a minimum medium-term horizon, in order to realise the above average return potential the company will likely continue to generate into 2021 and beyond.
Disclosure: I/we have no positions in any stocks mentioned, but may initiate a long position in VRTX over the next 72 hours. I wrote this article myself, and it expresses my own opinions. I am not receiving compensation for it (other than from Seeking Alpha). I have no business relationship with any company whose stock is mentioned in this article.