
Investment Thesis
McDonald’s Corporation (NYSE:MCD) currently presents a compelling investment case for total return investors, sustaining their $1.25/share quarterly dividend on Tuesday, ex-dividend August 31 and payable September 15 this year. Shareholders will realise a $5 per share annual payment in 2020, on a background of continued annual dividend increase over the previous 43 years, thus solidifying the company’s dividend aristocrat inclusion. The company is easily one of the most recognisable consumer food brands on a global scale, and an entry case is made at current trading of $198.72/share (at time of writing), on momentum increase of 45% from the March 2020 low.
MCD’s current posture on dividend coverage, return on capital and free cash flow, in addition to an evolving revenue model, bolsters the upside case. Additionally, from a repeated history of reinvestment in NWC and yearly share buybacks ultimately propping the share price to date, calls for capital gains into 2021 and beyond are made, with an upside potential ratio of 11.7% on monthly returns over the single-year period to date (monthly returns utilised for the scope of medium to long-term horizon players).
McDonald’s will post earnings this Tuesday 28/07/2020 and I will be providing additional coverage after the bell as a supplement to this report.
Dividend Growth & Coverage
MCD shareholders have realised consistent gains in annual dividend totals for over 40 years with demonstrated CAGR of 7.6% in payouts over the 5-year period to date. Current FWD yield is rated at 2.52%, which is in the 75th percentile of US dividend payers and although not particularly high in absolute terms, is superior to fellow dividend aristocrat heavyweights Nike (NKE) at 1% and Walmart’s (WMT) 1.64%. The FWD yield figure is made more attractive from the company’s proven track record in delivering 136.47% in total returns to shareholders over the past 5 years as a minimum.
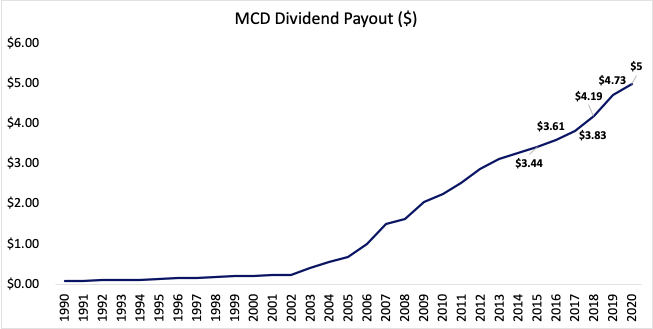
Data Source: Seeking Alpha; Authors Chart
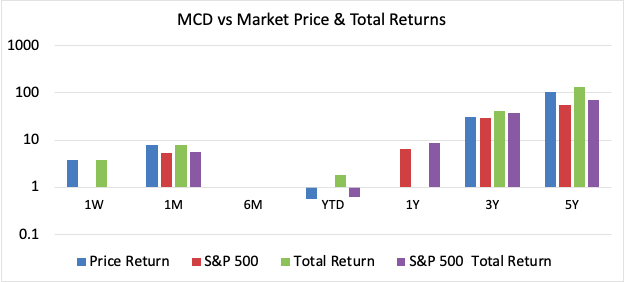
Data Source: Seeking Alpha, Authors Chart
MCD’s most recent dividend payout ratio was steep at 88.87%, which may be unsustainable in order to continue the current payout figure and growth estimates, especially in light of the company pulling its guidance for 2020 amidst Covid-19 market uncertainty. However, MCD shows profitability after meetings its obligations to date, recording lofty FCF of $4.13billion on a sound OCF margin of 36.83% moving out of 2020.
Thus, future payouts are seemingly covered at 1.1x coverage from current FCF/Share and this is reinforced with net income coverage of 1.47x over the FWD DPS figure. The total debt figure is covered by OCF at approximately 19x however the company has expanded its debt facilities over the previous 3 years by 44% up from 8.7% over this period. In light of this however, the total asset base has climbed 16.3% over this same period.
Moreover, the company’s long-term debt ratio registers 64.5%, demonstrating the company holds ~65cents in long-term debt for every dollar in total assets. Comparatively, the total leverage ratio has shot to 1.18 or 118%, highlighting the company’s considerable portion funding of its liabilities from its asset base. Consequently the ROE figure is difficult to evaluate at this point in time. On the back of asset turnover of 43% for every dollar invested, the debt ratio figure is to be watched closely by investors over the mid to long-term, especially as a stress test to evaluate leadership’s management over working capital and debt/liquidity. Pleasingly however, the company’s fwd interest coverage is well splayed on TTM and Quarterly times interest earned of 7.6x and 7.76x respectively, especially at current interest rates.
Expanding on a solvency basis, short-term obligations are well covered with current ratio at 1.89x, which is essential to factor considering the entity’s historical model to shareholders of reinvestment in net working capital and share buybacks to increase share price.
Profitability
Gross margins on revenues for 2019/March 2020 were 52.52%, with a net margin of 27.95%. These figures are aloft previous reporting periods, which is pleasing in the current retail climate. Earnings expansion in 2021 of 39.5% on revenue growth of 14.64% is also expected, obtained from linear regression of analyst estimates. FCF is poised to climb by 51% (using the same method) to $6.245billion by December 2021, representing a sizeable increase of cash available to shareholders and over 1.5x dividend coverage on a total FCF basis. These figures are attractive for total return players, especially as the company is in a mature growth phase and has committed to ongoing dividend fulfillment.
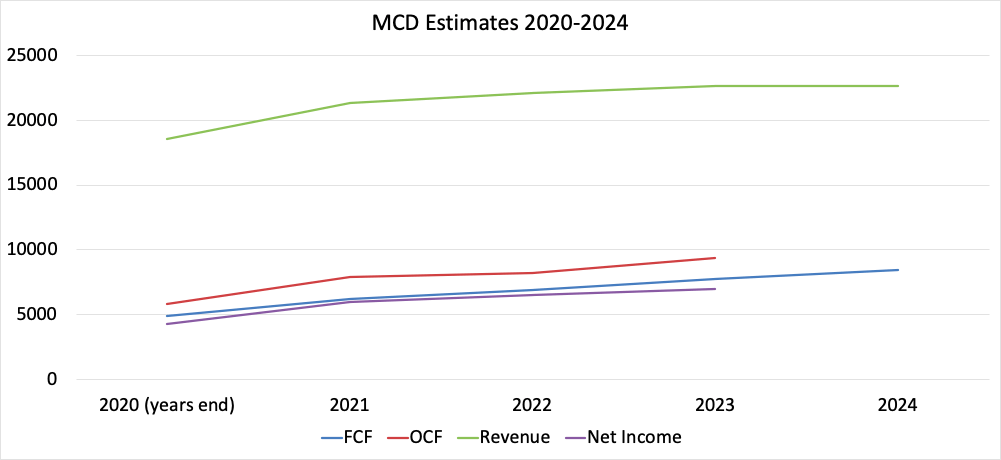
Therefore, the company seems well positioned to continue payouts to shareholders for the estimated FWD yield at 2.54% on the growth figure of 6.8%, also obtained through linear regression from the consensus of analyst estimates.
MCD Current Position:
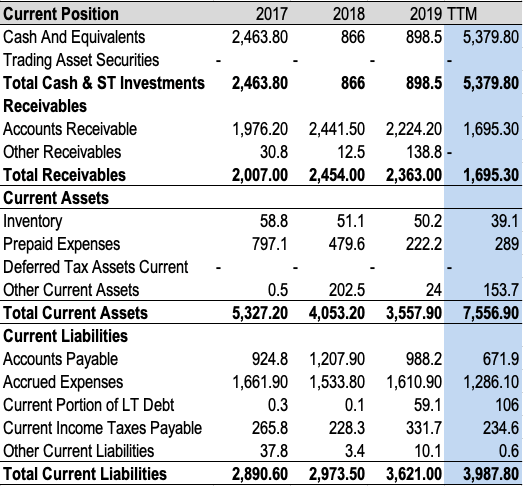
Data Source: Seeking Alpha; Authors Tabulation
The paradigm shift in health-focused fast food coupled with significant drive-through competition from peer companies Wendy’s (WEN) and conglomerate Restaurant Brands International (QSR), by way of example, has certainly led to a change in vision from MCD management. As such, the company has experienced slumped revenue growth and ROCE over multiple periods, registering TTM ROCE of 18.4%, which is down from 27.5% 3 years ago. ROCE growth is a primary metric that I personally use to screen for quality in valuation and growth, as many companies who show increasing ROCE are ubiquitous with improving valuations. Thus, one may disappointed on this information. However, the fact of the matter is that these figures have declined due to the company freeing up capital and altering the growth strategy, by divesting from owner/operator restaurants to shifting the carry of its products and services onto franchisees.
To illustrate, MCD announced ownership of roughly 2,500 owned restaurants vs 36,000 licensees operating franchises globally, meaning franchised operations represent over 93% as a total of stores. This signifies an operator to franchise ratio of approximately 0.069 and ultimately reduces execution risk in operations and forecasting risk in estimates, as revenue figures will show stability and predictability moving into 2020/2021, whilst eliciting greater margins on the back of the ongoing royalty payments.
From quick service restaurant entity QSR Magazine’s ranking of the top 50 fast-food chains in America, MCD has demonstrated superior growth in retail sales alongside more growth over same-store sales than pizza giant Domino’s Pizza and WEN, which highlights McDonald’s bastion-like position in the sector, illustrated in the graphic below.
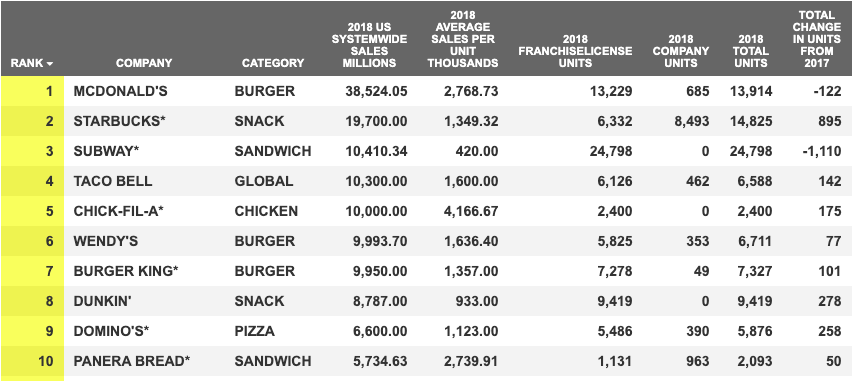
Data Source: QSR Magazine: Ranking The Top 50 Fast-Food Chains In America (2019)
Moreover, totaling US systemwide sales, total stores and average sales per unit, MCD is aloft the next 10 competitors, which highlights part of the economic moat that is formed around the financial citadel that is the McDonald’s enterprise. Competitors capturing market share does not seem as a threat to McDonald’s over the longer term, because of the immense resource base and demonstrated ability to divest and diversify to additional, profitable revenue streams in past periods – such as McCafe` in the coffee and pastry sector((s)).
Additionally, According to key insights from the Consumer Foodservice Report (2017), McDonald’s major sales categories chicken (burgers etc), burgers (category, beef & fish included) and coffee (through McCafe) are poised for increased sales trajectory worldwide over the next 3 years at least, which will allow MCD to expand and grow their existing markets ahead of competitors as these products produce the bulk of restaurant sales for franchisees and operated stores alike. Such information should be taken with precautions in response to the impact on retail sales of the Covid-19 pandemic.
Valuation
As the company has pulled its guidance for 2020 and is due for earnings posting on this coming Tuesday, FCFE analysis has been refrained at this stage. Additionally, total return investors will be interested in dividend calculations to make an informed investment decision.
McDonald’s is a mature, stable company paying ongoing dividends for many years, so it is appropriate to utilise a 2-stage dividend discount model alongside analysis of market ratio’s to bolster the valuation of the company. Using the model, we have arrived at a discount rate of 10.97% by summing the opportunity cost of the 10-year mean return from holding the S&P 500 index and the current 10-year US Treasury yield. The opportunity cost of holding the index was preferred over the equity risk premium of 6% secondary to possible inaccuracy due to significant equity market uncertainty at this point in time.
Although MCD has sustained dividends over many years, percentage growth has been inconsistent in many of those years. Thus, we assume that dividends will grow in line with analyst estimates each year over the next 3 years, and will continue to grow at the 5-year dividend CAGR of 7.6% thereafter.
2-Stage Dividend Discount Model:
|
Inputs |
Source |
Value ($ or %/100) |
|
Dividends Per Share, annualised (D0) |
Company Guidance |
=$1.25 x 4 =$5 |
|
Dividend Growth Rate |
Linear Regression Consensus Analyst Estimates |
0.068 |
|
Risk-Free Rate |
10-Year US Government note yield |
0.006/0.6% |
|
Opportunity Cost |
S&P 500 10-year Mean Return To Date |
0.129 |
|
(Adjusted for Inflation) |
CPI |
0.1036 |
|
Discount Rate Applied for Valuation |
Risk Free Rate + Opportunity Cost Holding S&P 500 |
|
|
=0.006 + 0.1037 |
0.1097/10.97% |
Data Source: Value line, S&P Global Indices, Authors Calculations
2-Stage Dividend Discount model:
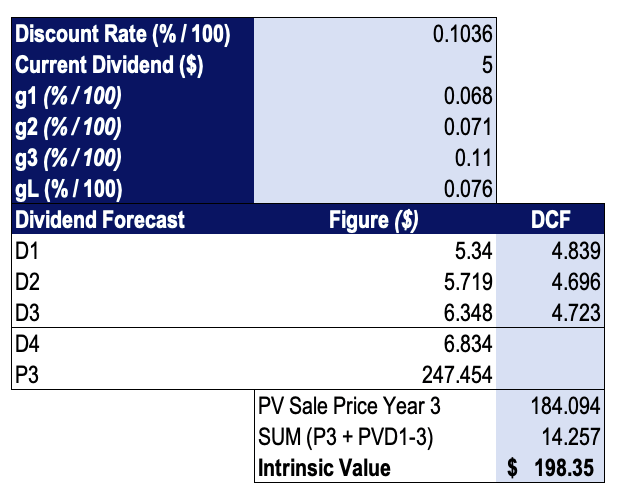
Data Source: Value Line MCD; Authors Calculations
Based on the assumptions outlined, the stock seems fairly priced at its intrinsic value of $198.35 on a market price of $198.72. Thus the case for potential capital gains is made on this valuation. For total return players, this equates to a potential holding period total return of 30.24% over the next single-year period and a price target of $247 over the same period, in contrast to a 27% gain received by current shareholders from the previous 3-year period.
The stock certainly trades at a premium P/E multiple of 26.01x, marginally above the industry median of 23.90x however well below competitor WEN at 46.72x. Peer entity QSR shows a multiple notably closer to the industry of 24.55x; however, investors perhaps should lay less weight to this valuation metric at present as many high P/E stocks in the S&P 500 index have returned up to 50% this year to date and show no sign of slowing down. For instance, elite tech stock Amazon (AMZN) currently trades at a P/E of 154x on growth of +50% over the single-year period to date.
As we can see, the P/E figure can merely represent the premium investors will pay for a share of earnings. Thus, in the case of McDonald’s, using a justified forward P/E multiple will be more a suffice metric.
Justified Forward P/E:
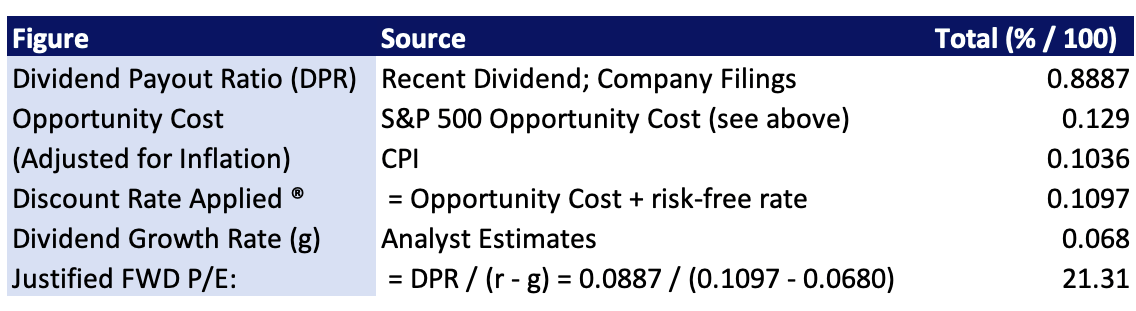 Data Source: Value Line MCD; Authors Calculations
In addition, the company shows a P/CF of $19.32, above the industry median figure and peer QSR, but under WEN’s figure of $21.45. On a P/FCF basis, MCD registers a value of 35.77, relative to WEN’s value of 62.89 and QSR’s figure of 13.86. On this figure MCD certainly evidences its capacity to generate additional revenues for shareholders into the future, essential in the dividend payment situation; but is still a high figure in absolute terms. Investors certainly expect big things from the company into 2021. Moreover, potential investors will need to watch this figures movement particularly after next earnings post.
It would be wise to use the EV/EBITDA figure in this sense as well considering the company’s expansion of long-term debt facilities. This stands at 19.02 for MCD, 14.32 for QSR and 22.29 for WEN over the TTM. MCD therefore seems priced in the middle of these 2 securities on this front. Additional valuation metrics are observed below:
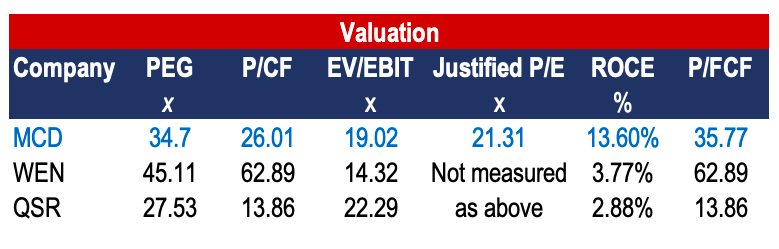
Data Soure: Value Line MCD; Seeking Alpha; Authors Calculations
Further Company Considerations
Retail sales across the board have taken a massive hit over the course of this year. Fast food restaurants are no different, and the horizon is uncertain for all of the hospitality and retail sector. Thus there are inherent risks in this sentiment and it is hard to call how things will affect the company moving forward. Earnings guidance for Tuesday 28th July will provide better insight.
On a separate note, drive through time averages were recorded at ~284 seconds (or around 4mins and 44 seconds) for 2019, below competitor Wendy’s (WEN) average benchmark of 133 seconds to show example. At that speed, this represents a maximum capacity of 12.68 customers per hour and approximately 190 customers per day in drive-throughs across a 15 hour period (6am – 11pm), which represents the major trading times for food purchases. Additional figures could be calculated for 24 hour restaurants. Around 33% of restaurants report 3-5 cars in the drive through at one time with many reporting less on average.
The Acquisition of Dynamic yield in 2019 is estimated to shave 20seconds off the drive through time. To compare, this would translate to an increase to 204.5 potential drive-through customers for each restaurant, in the hypothetical case of each restaurant performing at maximum traffic capacity.
Perceivable Risks
Risks are not constrained to the effect of COVID-19, but for me this represents the largest factor to shareholders and potential investors. There has to be a continued display of competence from leadership in managing working capital in these times.
For instance, the shift of carry towards franchisees relies heavily on royalties and rental yield from store space. In the event of ongoing reduction in foot traffic, this will ultimately impact the company’s earnings from this stream. In the REIT sector for example, there have been numerous reports of struggling funds and companies on this very point. Thus, liquidity preservation is essential and management will need to evidence the ability to prevent value erosion on the back of falling sales numbers, if there were to happen.
Furthermore, the company continues to evolve its growth strategy, which presents execution risk and doesn’t guarantee success. Lucky the company has large cash reserves for reinvestment into net working capital. Investors unwilling to enter under the current market climate can use this time as a stress test to evaluate the raised points, using key metrics such as ROCE, P/CF, P/FCF and earnings growth/decline the standard.
Conclusion
Various dividend payers have cut dividends amidst the Covid-19 market turmoil and many more face insolvency. MCD has shown sustenance in this regard and by all regards is well positioned into 2021 to weather any future turbulence. Being arguably the most recognised food brand in the world means McDonald’s will have many tricks up their sleeve as well. They are certainly not out on their haunches, and for total return players, there lies an excellent opportunity to capture the capital gains alongside the dividend yield over the coming periods. On a price target of $247, the bulls have it for mine, and the stock is poised to continue its rebound since the market selloff. I will provide a follow up report following the next Earnings post in a few days, and again over the coming months, to confirm or negate the points raised within this analysis summary.
Disclosure: I/we have no positions in any stocks mentioned, and no plans to initiate any positions within the next 72 hours. I wrote this article myself, and it expresses my own opinions. I am not receiving compensation for it (other than from Seeking Alpha). I have no business relationship with any company whose stock is mentioned in this article.
