
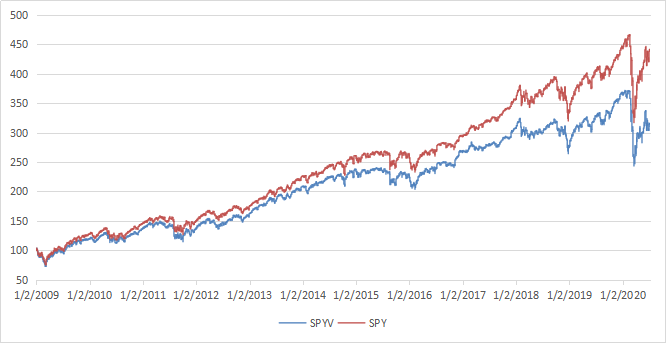
Most value-driven strategies have lagged the market for years. It is visible in value ETFs. The SPDR Portfolio S&P 500 Value ETF (SPYV) has returned 210.92% since 1/1/2009 or 10.35% annualized vs. 341.39% or 13.76% annualized for the SPDR S&P 500 ETF (SPY). The next chart shows the evolution of an investment of $100 in both ETFs.
The next chart plots the equity value of a market-neutral long-short portfolio containing half of all S&P 500 stocks in equal weight since 1999, rebalanced every 4 weeks. The long side has the 125 cheapest stocks, the short side contains the 125 most expensive stocks.
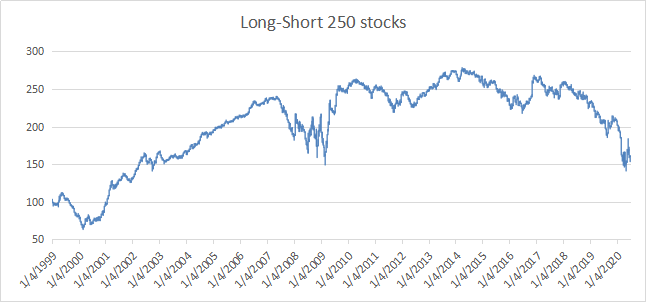
To build this hypothetical portfolio, stocks are ranked separately on 4 ratios: price/earnings, price/book, price/sales, and price/free cash flow. Then, stocks with the 125 highest and 125 lowest rank sums are listed. As several stocks may have the same rank sum, they are finally ranked on the price/book ratio to select the 125 cheapest and 125 most expensive stocks. Ranks are calculated every 4 weeks, resulting in the equity curve above. The highest point was reached in October 2013. We can deduce that the pure value investing style has underperformed since then.
We can define a metric for the relative valuation of the value investing style by calculating the difference between the logarithm of the second chart’s time series and its linear regression. The purpose is discounting the average excess return of the value investing style over the time interval. The third chart below plots this metric.
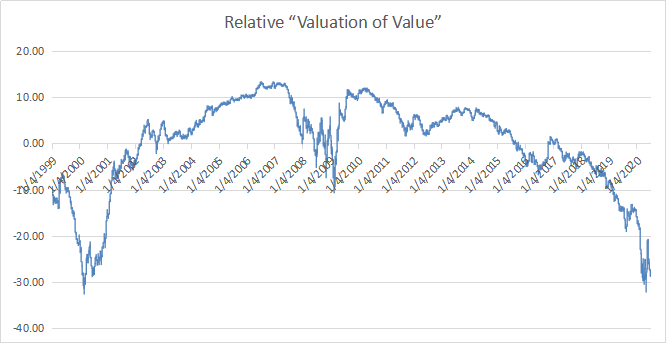
In reality, the average excess return of the value investing style is not a constant. It would be different on a longer interval. However, this metric gives a pretty good idea of the value style cycles in the last 2 decades.
According to this chart, value stocks look cheaper now than after the 2008 meltdown, at a level not seen since 2000. They are cheaper relative to the most expensive part of the market, but the market as a whole is more expensive.
This chart is likely to revert to the mean at some point. We could give quantified targets if the mean and the standard deviation were constants. Here, mean reversion is more a common-sense idea that can’t help make a quantified, timely prediction. Anyway, from a long-term perspective, value stocks show a strong anomaly. Large-cap value stocks have not looked so cheap relative to expensive stocks for 20 years.
Anyway, value is a bad timing indicator. Quantitative Risk & Value (QRV) provides you with a more realistic quantitative approach, for a world of probabilities instead of just risk on/risk off. It includes a systemic risk indicator and strategies based on it. It has not been able to predict Covid-19 black swan, but it sent an alarm signal 2 months before the NBER declared the U.S. is in a recession. Get started with a two-week free trial and see how QRV can improve your investing decisions.
Disclosure: I/we have no positions in any stocks mentioned, and no plans to initiate any positions within the next 72 hours. I wrote this article myself, and it expresses my own opinions. I am not receiving compensation for it (other than from Seeking Alpha). I have no business relationship with any company whose stock is mentioned in this article.
