Since the start of the pandemic, Montreal districts with higher numbers of Black people and more cramped housing have registered the most cases of COVID-19, according to an analysis by CBC News.
The findings echo similar observations made in other major North American cities, where the novel coronavirus has disproportionately affected the poorest and most racially diverse neighbourhoods.
“This says the conditions in which people are living leave them exposed in a very serious, excessive way to COVID-19,” said Tiffany Callender, executive director of the Côte-des-Neiges Black Community Association.
Unlike in some other jurisdictions, in Canada, public health officials have not disclosed data on the race of COVID-19 patients. That has frustrated community activists like Callender, who says such information could have been used to identify and protect vulnerable communities.
“As Black people, our shared lived experience is not considered. The only way to prove it is with race-based data,” she said.
“We need data because they are not going to believe it just because we said so.”
Though the provincial public health director, Dr. Horacio Arruda, promised in early May the government would begin collecting race-based health data, the Health Ministry acknowledged Wednesday there are no immediate plans to do so.
“We understand the importance of this information and are sensitive to it,” the ministry said in a statement to CBC News.
For the moment, the ministry said, “all our efforts are being put toward protecting the population and those infected.”
In order to get a more accurate picture of how race and other socio-economic factors have played a role in the outbreak, CBC News cross-referenced census data with case numbers for each borough or municipality, released daily by the public health authority for the island of Montreal.

We performed a simple statistical procedure known as a linear regression to establish which correlations are the strongest.
Of the 24 socio-economic factors we tested, the strongest correlation was between cases per 100,000 residents and the percentage of Black residents.
We also found strong correlations for concentrations of health-care workers, low-income earners and unsuitable housing (a measure of whether there are enough bedrooms for the size of a household).
“The pandemic has really helped to reveal some of the structural inequalities we know have been around for a long time in Montreal but haven’t done anything about,” said McGill University Prof. Sam Harper, a social epidemiologist who reviewed CBC’s findings.
“In some respects, this is consistent with what we’ve been hearing both in Canada and in the U.S., which is that places that are already disadvantaged in terms of their social circumstances are also experiencing a heavier burden of COVID.”
A correlation study such as the one performed by CBC does not determine what factors cause the relationship, nor does it explain how several different factors may interact with each other.
Harper cautioned that it can be difficult to draw strong conclusions about how any one factor can put people at risk, because “many of these indicators of disadvantage can occur together in the same neighbourhoods.”
Our correlation study also can’t adequately represent the experiences of communities that don’t make up significant proportions of a neighbourhood population.
The incidence of COVID-19 among Indigenous residents of the city, for instance, would likely be under-emphasized, though advocates say their social situation makes them particularly vulnerable to infection.
Given these limitations, here is a closer look at our findings and what they mean for the people living in these neighbourhoods.

The Montreal boroughs with large Black populations have been the hardest hit by COVID-19. The correlation between cases and race was stronger for Black people than for any other visible minority.
Montréal-Nord, home to a large Haitian community, is the borough with the highest per capita case count on the island: 2,911 cases per 100,000 people, as of June 9.
The other hard-hit boroughs in the city — Rivière-des-Prairies–Pointe-aux-Trembles and LaSalle — are also home to sizeable Black communities. The neighbourhood of Saint-Michel has a large Black community, too, but its COVID-19 numbers are grouped together in the borough with Villeray and Parc-Extension.
The connection between race and cases of COVID-19 is best understood alongside many of the other socio-economic characteristics of Montreal’s Black community, said Will Prosper, a filmmaker and community activist in Montréal-Nord.
“We have a lot of underpaid health-care workers,” Prosper said. “We also have a lot of front-line workers who lack their own mode of transportation. We have lots of people who live in high-density apartments, so the risk factor is greater.”
Community groups in Montréal-Nord tried to warn public health officials at the outset of the pandemic that the borough was likely more vulnerable than others.
But authorities were slow to respond to those concerns, said Prosper, whose organization Hoodstock, along with other community groups, took the initiative of distributing masks and hand sanitizer.
“If they had listened to us, perhaps we would have not been impacted so significantly,” Prosper said.
A link between race and rates of COVID-19 has been established elsewhere in Canada, as well.
Kate Choi, an assistant professor of sociology at Western University in London.Ont., looked at the racial makeup of health regions in Canada and also found that those with more visible minorities tend to have higher rates of infection.
“You consistently see that visible minority groups tend to have a health disadvantage,” she said. “Even native-born black Canadians, after controlling for socio-economic status, race will have an impact on their health. This can be attributed to things like discrimination.”
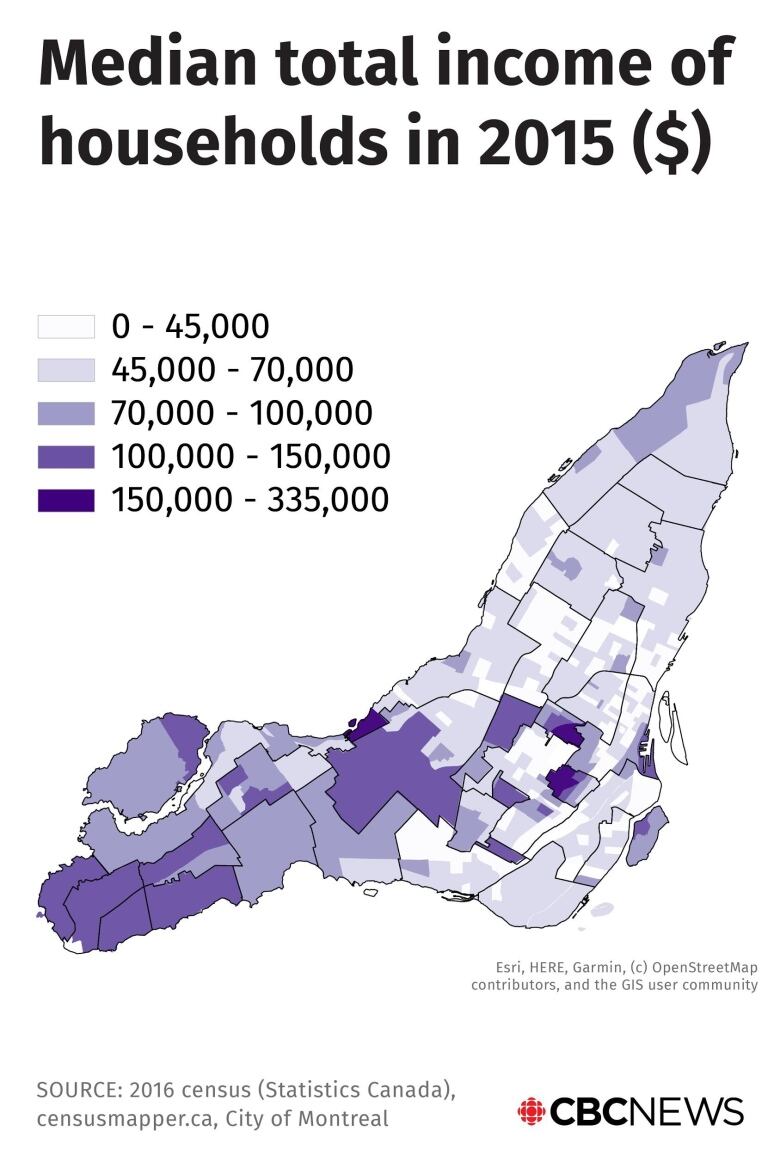
There is also a strong correlation between low-income neighbourhoods and COVID-19.
The poorer, eastern part of Montreal island, including the boroughs of Montréal-Nord and Villeray–Saint-Michel–Parc-Extension, is more affected by the pandemic than central boroughs and the suburbs in Montreal’s West Island, such as Pointe-Claire and Kirkland.
Income is a key driver of many other socio-economic factors, including health, a wide body of research has shown.
“Often the neighbourhoods, and the people that are most affected, are people who are already disadvantaged in terms of their social circumstances and occasionally also in terms of their underlying health conditions,” said Harper, the McGill epidemiologist.
People with low incomes also tend to have jobs that can’t be done from home or that don’t allow for physical distancing.
Note that Rosemont–La Petite-Patrie, Ville-Marie, and the Sud-Ouest borough, in central Montreal, have lower-than-average incomes but weren’t affected by COVID-19 in the same way that eastern Montreal boroughs were.
As shown in the maps below, the most affected low-income boroughs have more people who work in essential services such as health care, social work and manufacturing but who have lower rates of post-secondary education.
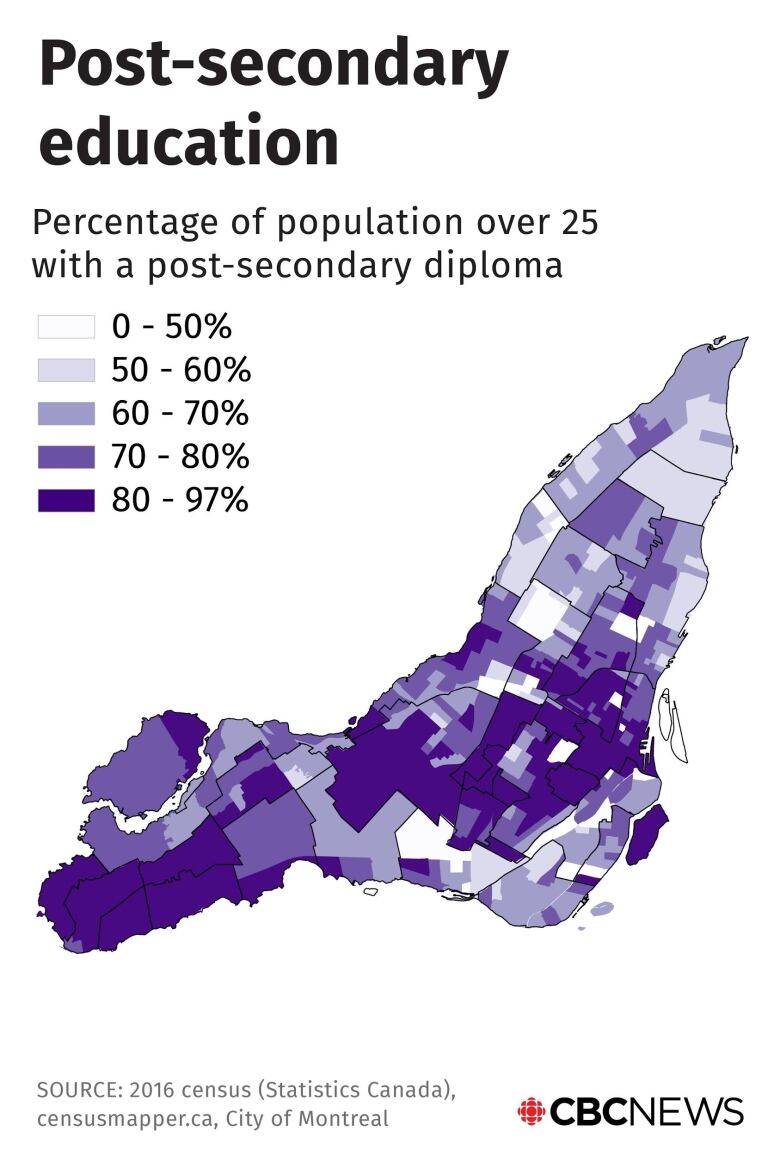
Education is closely tied to income and is a predictor of socio-economic mobility. The higher the education level, the more job options one has, said Choi.
Areas with a higher rates of educated people, including much of Montreal’s West Island, also saw fewer COVID-19 cases.
“Education is a predictor of lifelong socio-economic mobility,” she said.
It’s also a predictor of what kind of work you end up doing.
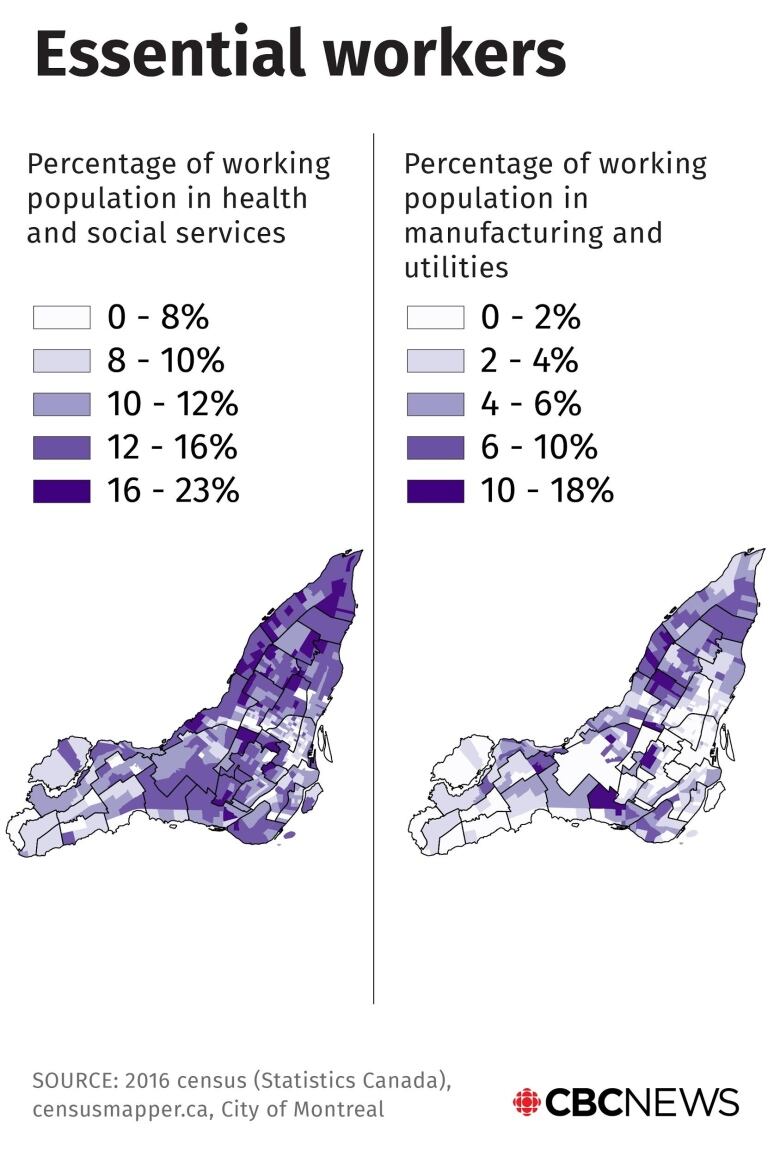
The map above, on the left, shows the proportion of people who work in health care and social services.
The map on the right indicates the proportion of people who work in manufacturing and utilities jobs.
Neighbourhoods with a higher proportion of essential workers, in all of those sectors, showed a strong correlation to a higher rate of COVID-19 cases.
People working in those sectors are doing jobs that can’t be done from home and often require sustained, close contact with others, such as stocking shelves or working as cashiers in grocery stores.
The lower-paid health care sector includes orderlies, auxiliary nurses and other staff in the province’s long-term care homes, known as CHSLDs, where the virus spread unchecked.
Experts say a lack of sufficient quantities of protective equipment and inadequate training for how to use that equipment contributed to the spread of the virus, not only inside CHSLDs but in the homes and wider communities of their staff.
It was initially thought that dense neighbourhoods, given the difficulty in maintaining physical distancing, would be harder hit by COVID-19.
But it appears that neighbourhood density isn’t a strong predictor of the spread of the virus. The tightly packed borough of Plateau-Mont-Royal and Ville-Marie, the downtown Montreal borough, had relatively few cases.
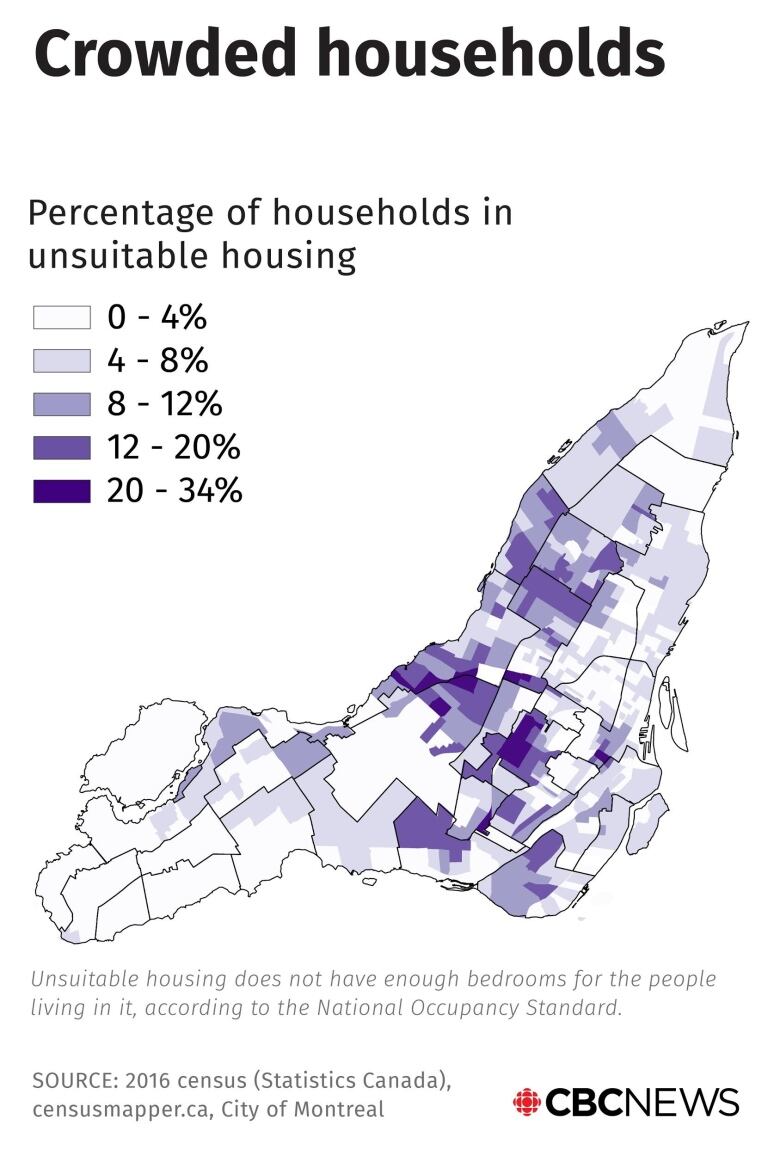
A better predictor is unsuitable housing, according to our findings.
A greater number of cases were seen in the boroughs of Montréal-Nord and Ahuntsic-Cartierville, where people tend to live in crowded households without enough bedrooms.
“These could be multi-generational households in densely populated areas,” Choi said. “There is some research that shows that crowded quarters can have higher rates of infection.”

Montréal-Nord stood out in another way.
It is the Montreal borough with the smallest area of parks and green spaces per resident, with only five square metres per person, compared to neighbouring Ahuntsic-Cartierville, which has close to 20 square metres for each resident.
That doesn’t necessarily mean that the borough’s residents are crowding into parks and potentially infecting one another, Choi said.
Green space availability could simply be a function of population density.
“The neighbourhood may not be a place where you can easily walk, where you need to take public transit, so there’s a higher risk of exposure,” she said.
Methodology
CBC News compared the number of confirmed COVID-19 cases by borough from the Montreal Public Health to census measures by borough from the city’s statistics bureau.
Using the Python programming language, a linear regression analysis and Pearson correlation co-efficients were calculated for each census measure against the COVID-19 numbers.
For the maps, CBC News used census data by census tract to visualize more detailed regional variations. The data came from Statistics Canada and censusmapper.ca and was visualized using Esri ArcGIS.
Here are the Pearson correlation co-efficients for the socio-economic factors we tested (figures closer to 1 or -1 indicate stronger correlations):
- Black, percentage of population: 0.672474.
- Manufacturing/utilities occupations, percentage of population: 0.661409.
- Health/social services industry, percentage of population: 0.659599.
- Unsuitable housing, percentage of population: 0.575595.
- Low-income cut-off, percentage of population: 0.485746.
- Refugees, percentage of population: 0.473354.
- Public transit, percentage of population: 0.446027.
- Visible minorities, percentage of population: 0.442006.
- No official languages, percentage of population 0.362192.
- Immigrants, percentage of population: 0.357369.
- Arab, percentage of population: 0.354491.
- Retail, percentage of population: 0.325954.
- Latin American, percentage of population: 0.278190.
- Southeast Asian, percentage of population: 0.236344.
- Hospitality and restaurants, percentage of population 0.224697.
- Manufacturing industry, percentage of population: 0.186766.
- Average number of people per family: -0.151805.
- Filipino, percentage of population: -0.196859.
- Median income, in dollars: -0.565701.
- Post-secondary diploma, percentage of population: -0.581759.
- South Asian, percentage of population -0.598611.
- Chinese, percentage of population: -0.620794.
