
- USD meets long term support structure.
- Bulls can target the prior daily lows that have a confluence with the golden 61.8% ratio.
The US dollar has been bleeding considerably into the start of June. A number of factor shave contributed to its downfall, from risk-on and resilient equities to a consensus that the worst of the economic damage from COVID-19 is behind us.
The US dollar had been in demand in the offshore markets in a panic-driven flight to cover the debt denominated in the greenback. Given the shortfall of available cash in the monetary system, a squeeze led to a strong rally that not even the Fed could tame with its printing of dollars. However, the greenback has finally let out some air and has recently slipped below the 98 handle in the DXY and the question now, is how much can it pull back before sliding even further?
Taking a look to the charts, we can see some compelling structure and technical analysis to help us gauge how the dollar might fare at this juncture and crucially assist with the analysis across the FX board for which it competes against.
DXY month chart
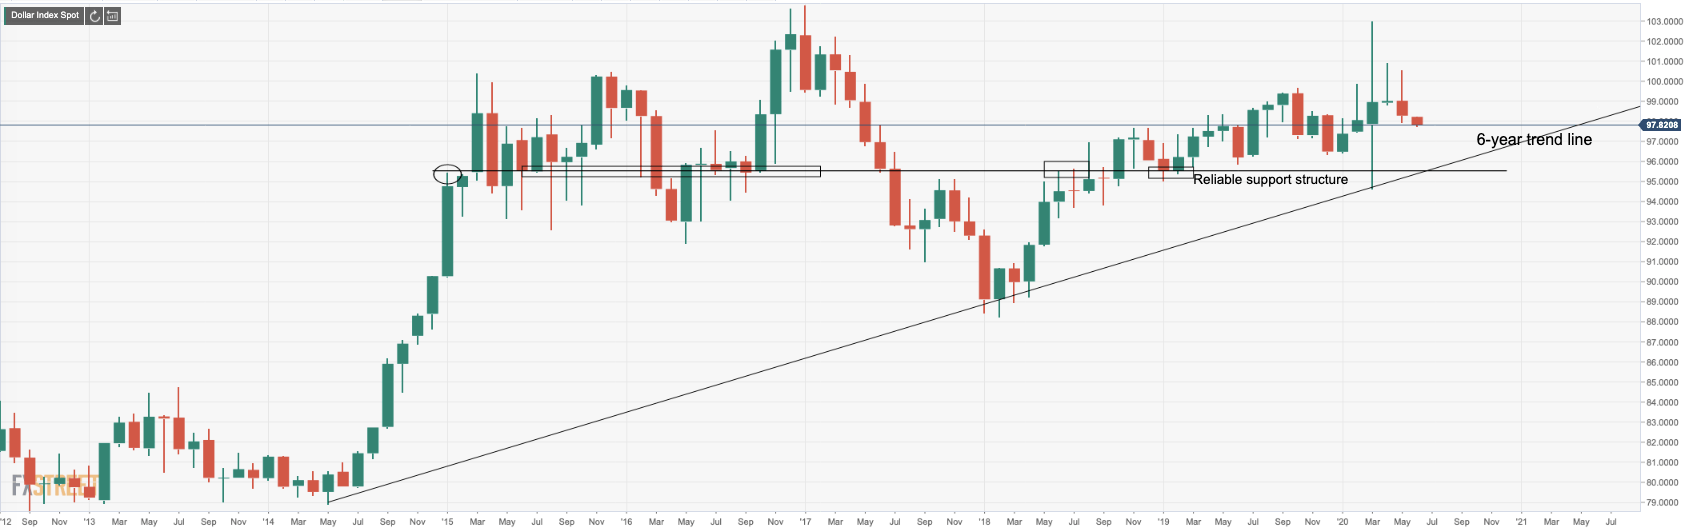
There is a tendency for price to move to test the trendline considering its failures to create higher highs in the March 2020 rally, failing to penetrate the 2017 highs. However, the price has met a prior resistance level which could prove to be a tough nut to crack. This is located at the Oct and Nov highs of 2018 – June 2019.
While the trendline target is the base case, we need to look at the near-term structure and gauge what levels are in play immediately.
Daily chart
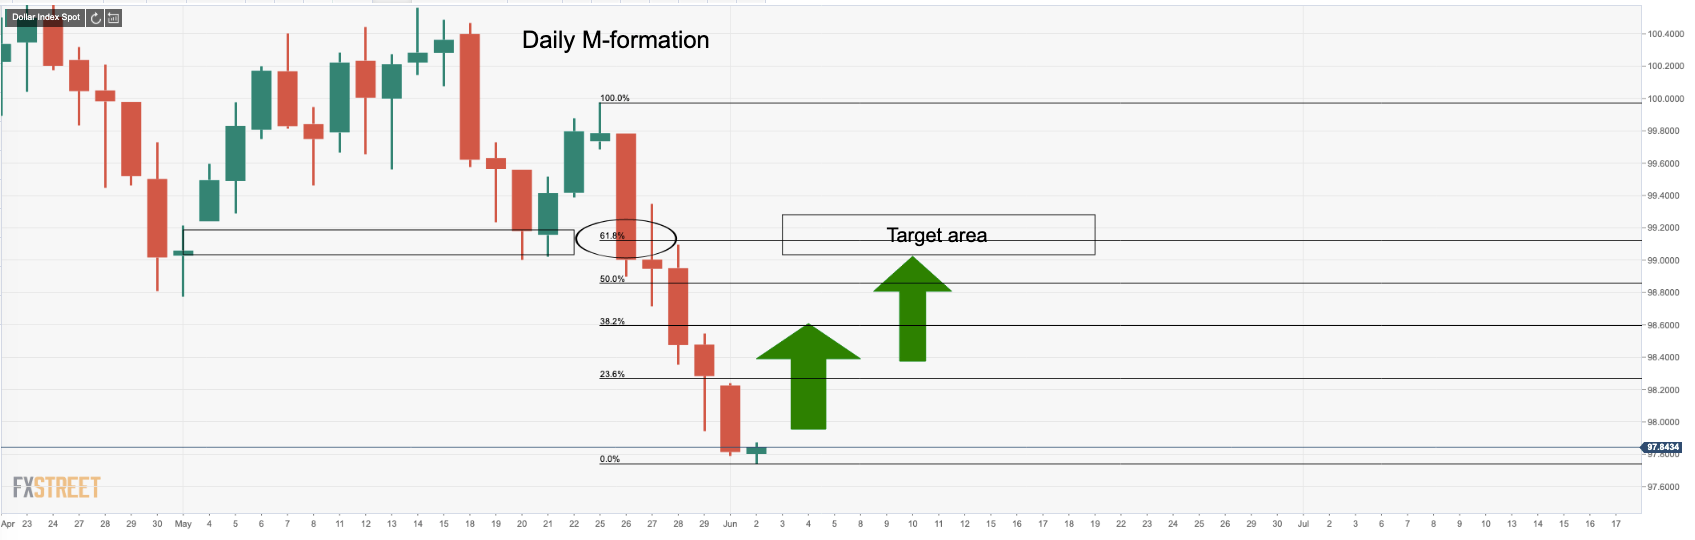
M-formations have a tendency to hamstring the breakouts and pull the price back to the neckline.
In this daily formation, the prior lows have a confluence with the golden 61.8% ratio. This is making for a compelling bullish target level prior to further downside targets and to said trendline support. At this juncture, there is no momentum indication that the downside rally has not completed, but the prior said resistance could encourage a phase of accumulation towards said target.
