A long running component of the Dow, Caterpillar (CAT) has performed slightly worse than the index, falling 14.46% and 28.89% on the one-month and three-month periods respectively, while the index lost 12.67% and 21.76%. Involved in the production of heavy machinery, Caterpillar’s core revenues are cyclical in nature, and can see periods of revenue losses stretching for quarters on end, when facing unfavorable macroeconomic conditions. Quarterly revenue last peaked in Q2 2019, and has begun to decline again; the coronavirus shutdown will most likely accelerate losses in its three machinery segments and revenue declines could continue for the rest of FY20.
Business Segments
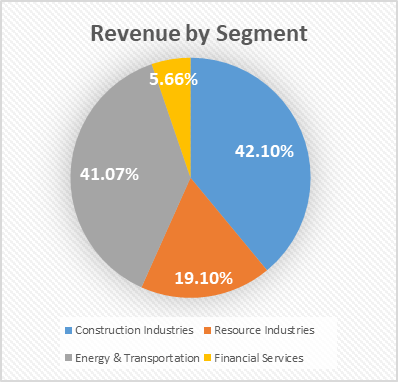
Caterpillar’s business is focused in 2 core parts, machinery and financial services; machinery typically accounts for 94-95% of total revenues, and financial 5-6%. Machinery is composed of three segments – construction industries, resource industries, and energy and transportation. Construction deals with “infrastructure, forestry and building construction [and a] majority of machine sales in this segment are made in the heavy and general construction, rental, quarry and aggregates markets and mining.” Resource serves “mining, heavy construction, quarry and aggregates, waste and material handling applications [with machinery primarily used to] extract and haul copper, iron ore, coal, oil sands, aggregates, gold and other minerals and ores.” Energy and transportation serves “oil and gas, power generation, marine, rail and industrial applications.”
Revenues by Segments and Regions
Data from FY19 10-K
Caterpillar’s total revenues for FY19 came in at $53,800 million, down from $54,722 million in FY18. Of the three machinery segments, construction and energy & transportation accounted for 83.17% of total revenues – a figure of $44,746 million. Financial services account for only $3,045 million in revenue, and comprise only a small portion of Caterpillar’s overall business.
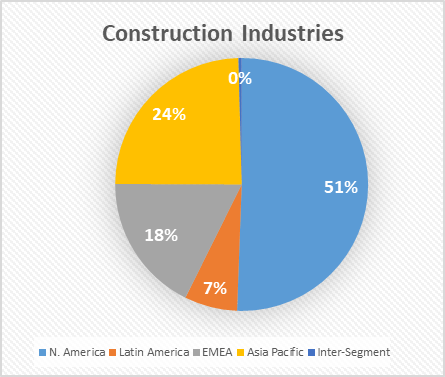
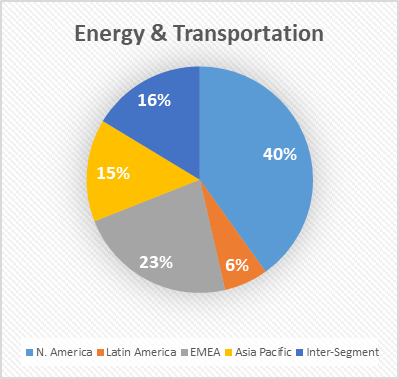
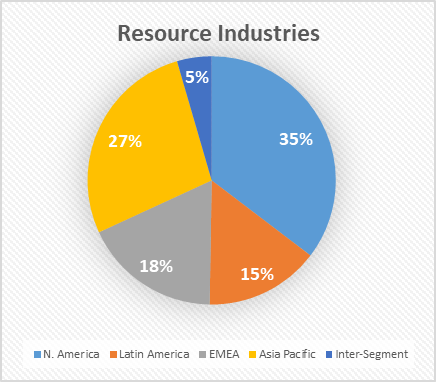
After breaking down the three key machinery segments into regional revenue proportions, it can be noted that a majority of Caterpillar’s business occurs in North America, Asia/Pacific, and EMEA (Europe/Middle East/Africa). Latin America only comprises a double-digit percentage in the resource industry breakdown, as that segment provides machinery primarily involved in resource extraction.
North America and Asia-Pacific account for a majority of revenues in the construction and resource segments, with N. America contributing 51% of total revenues for construction equipment. EMEA comes ahead of Asia-Pacific in energy & transportation, although both are far ahead of Latin America. Inter-segment sales of 16% for energy & transportation were primarily in engines.
Risks to Business
Since construction, mining and resource extraction, and related industries are long-timeline, high-cost and generally extensive, they are cyclical in nature, and are undertaken in higher quantities when conditions are favorable. Caterpillar acknowledges that sales revenue and related operations “can be significantly reduced in periods of economic weakness characterized by lower levels of government and business investment, lower levels of business confidence, lower corporate earnings, high real interest rates, lower credit activity or tighter credit conditions, perceived or actual industry overcapacity, higher unemployment and lower consumer spending.” With the current pandemic, business confidence (albeit more so inability) has shrunk dramatically, with non-essential businesses ordered to close doors. With Caterpillar’s revenues highly concentrated in the world regions hardest hit by coronavirus – N. America, Asia-Pacific, and EMEA, business investment as well as government investment in construction projects (besides that of necessary temporary hospital construction and related infrastructure) could fall. The United States has already witnessed a record high weekly unemployment claims, and risks related to unemployment and decreased consumer spending will have a material effect on revenue.
Within resource industries, which are focused in “iron ore, gold, copper, oil and natural gas,” Caterpillar expects customers to base “decisions to purchase our products and services on the expected future performance of these industries, which in turn are dependent in part on commodity prices.” As oil falls to lows not seen since the early 2000s, and natural gas seeing a similar decline, combined with falling performance of smaller oil and natural gas producers, demand for Caterpillar’s machinery will take a hit. Since the nature of the resource extraction and oil and gas industries are characterized by volatile cash flows in response to volatile commodity prices, any “downturns in financial markets [can] decrease the availability of liquidity, credit and credit capacity for certain issuers, including certain customers, dealers and suppliers.” Even if certain customers might witness smaller adverse effects due to the current volatility, credit lines and future purchasing abilities on credit could possibly decline, causing future declines in demand.
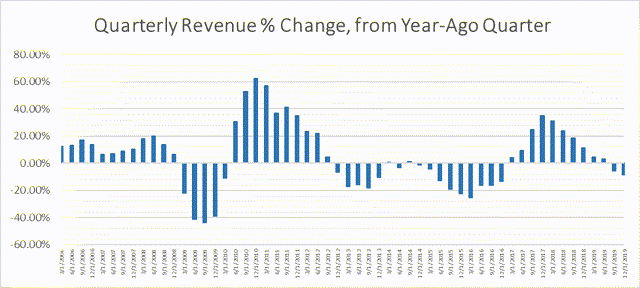
Cyclical Nature of Revenues
Data from FY19 10-K
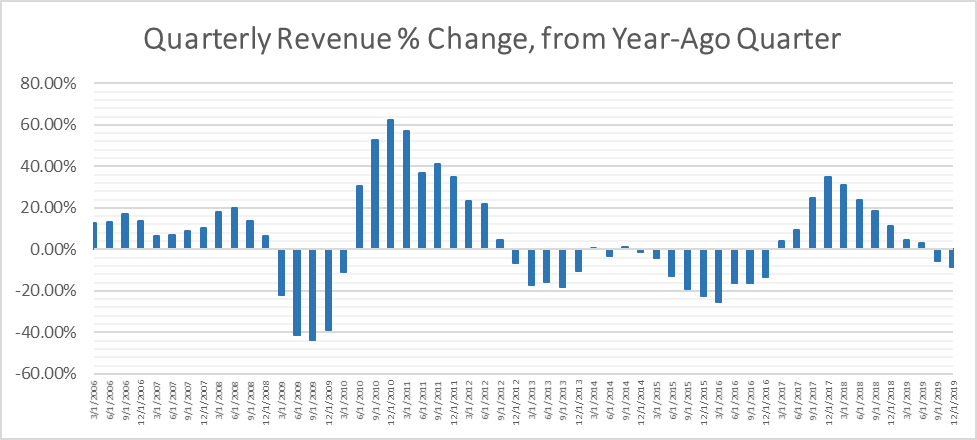
Quarterly revenue for Caterpillar last peaked at $14,432 million in Q2 2019, representing a 23.65% change from Q2 2018. Although quarterly revenues do not show too much of a cyclical pattern, looking at quarterly revenue growth in comparison to the year-ago quarter shows that cyclical nature. Following the recession, Caterpillar’s quarterly revenues grew from $7,298 million in Q3 2009 to $17,243 million in Q4 2011. Following that peak, and subsequent demand issues in Brazil during 2015 and 2016 due to its economic crisis and in China during the beginning of the US trade war, Caterpillar had quarterly revenues declining steadily to $9,160 million in Q3 2016.
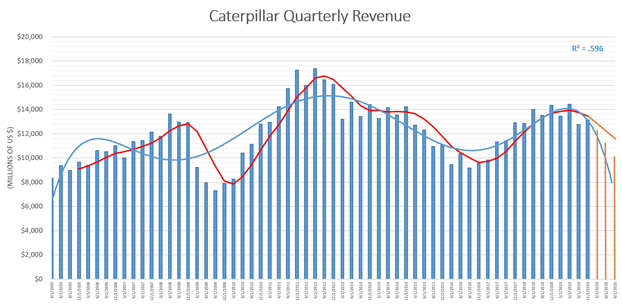
On average, Caterpillar’s quarterly revenue declines in comparison to the year ago quarter last between 5 to 6 quarters. With current YoY quarter changes only at 2 consecutive quarters, Caterpillar could still face 3 to 5 quarters with revenues lower than the year-ago period. Such declining revenues can be predicted on the second graph, with quarterly revenues for the upcoming three quarters plotted in orange. Hypothetical numbers were generated using a 4-period moving average (graphed in and predicted in orange) and a linear regression model. With the model having a variance of .596, predictions for revenue declines were placed closer to the median between the moving average and the regression, so as not to bias predictions in favor of the regression model.
With these predictions, Caterpillar’s annual income can be estimated to fall to $43,000 million to $47,000; demand shocks, further adverse economic events and prolonged volatility, or long-term industrial contractions could further dampen revenues, although $43,000 million already is a 20% YoY decline in revenue.
|
Predicted Revenue |
$43,000 |
$44,000 |
$45,000 |
$46,000 |
$47,000 |
|
Gross Income |
$12,161 |
$12,444 |
$12,727 |
$13,010 |
$13,293 |
|
Op. Income |
$5,680 |
$5,812 |
$5,945 |
$6,077 |
$6,209 |
|
Net Income |
$2,933 |
$3,001 |
$3,069 |
$3,137 |
$3,205 |
|
EPS |
$5.16 |
$5.28 |
$5.40 |
$5.52 |
$5.64 |
|
Margins |
Q4 18 |
Q1 19 |
Q2 19 |
Q3 19 |
Q4 19 |
5Q avg. |
predicted |
2008 |
2016 |
|
Gross |
30.78% |
33.34% |
31.12% |
32.94% |
30.73% |
31.78% |
28.28% |
24.00% |
27.00% |
|
Operating |
15.10% |
18.16% |
16.66% |
17.50% |
16.11% |
16.71% |
13.21% |
2.00% |
3.00% |
|
Net |
7.66% |
12.65% |
11.23% |
11.71% |
8.35% |
10.32% |
6.82% |
3.00% |
0.00% |
At revenues between $43,000 million to $47,000 million, Caterpillar’s predicted EPS could fall in the range of $5.16 to $5.64 ($5.40 median), using an average net income margin of 6.82% to calculate net income attributable to shares. The first table shows average predicted levels of gross, operating, net income and EPS, using values from the “predicted” column in the second table below. The predicted average column was created using the past 5 quarter margin averages minus 3.5% to account for a decrease in revenue as well as a harsher environment for conducting business, which could negatively impact margins. Comparing the predicted margins to the previous two margins at Caterpillar’s three worst quarters during 2008-09, and 2015-16 shows margins being significantly higher, although this can be attributed to Caterpillar’s stabilization of margins in the past two fiscal years.
Conclusion
Caterpillar looks to be continuing with a cyclical revenue decline accelerated by the downturn in global financial markets, which could dampen revenues for at least the full FY20. If economic conditions continue to deteriorate, Caterpillar could face a prolonged cyclical decline, with revenue declines extending to mid-year 2021. It seems as if Caterpillar had already begun to start a cyclical downturn again, but look for it to be considerably sharper in the following two quarters. Although still a strong value stock with a long history of stable dividends, Caterpillar could sit within the $90-$130 range as revenue cyclicality looks set to continue, with past highs of $175 and $150 achievable after the next up cycle.
Disclosure: I/we have no positions in any stocks mentioned, and no plans to initiate any positions within the next 72 hours. I wrote this article myself, and it expresses my own opinions. I am not receiving compensation for it (other than from Seeking Alpha). I have no business relationship with any company whose stock is mentioned in this article.
