
If your business isn’t taking a closer look at its data, there’s a whole world of possibilities that you’re missing.
With the help of business analytics, your organization can do more with its data than ever before, you just have to know where to start. Whether you’re making predictions or finding trends, statistical analysis is your best bet for the insights you need.
What is statistical analysis?
Statistical analysis is the process of collecting and analyzing samples of data to uncover patterns and trends and predict what could happen next to make better and more scientific decisions.
There is a lot that a business can do with its big data, and statistical analysis is a way for organizations to examine and learn from it in a smart way. It deals with a variety of components of data, including data collection, surveys, and experiments.
As an aspect of business intelligence, statistical analysis scrutinizes business data and reports on trends using five key steps.
- Describe the type of data that will be analyzed
- Explore the relation of the data to the underlying population
- Create a model to summarize the understanding of how the data related to the underlying population
- Prove, or disprove, the validity of the model
- Use predictive analytics to run scenarios that will guide future actions
DEFINING A POPULATION: In statistics, a population is the entire group of data that is being analyzed. This may refer to data like an entire group of people, objects, animals, how many visits are taken to the hospital in a year, events, or even measurements. It can be any size, as long as it includes all the data being analyzed.
If you’re looking for more information about statistical analysis, feel free to jump ahead to:
Data analysis vs. statistical analysis
What are the types of statistical analysis?
An example of statistical analysis
Statistical analysis software
Importance of statistical analysis
Once the data is collected, statistical analysis can be used for many things in your business. Some include:
- Summarizing and presenting the data in a graph or chart to present key findings
- Discovering crucial measures within the data, like the mean
- Calculating if the data is slightly clustered or spread out, which also determines similarities
- Making future predictions based on past behavior
- Testing a hypothesis from an experiment
There are several ways that businesses can use statistical analysis to their advantage. Some of these ways include identifying who on your sales staff is performing poorly, finding trends in customer data, narrowing down the top operating product lines, conducting financial audits, and getting a better understanding of how sales performance can vary in different regions of the country.
Data analysis vs. statistical analysis
In the world of business intelligence, it’s not uncommon to confuse statistical analysis and data analysis to solve various problems that an organization may experience. However, the data analytics tools and overall process have key differences when compared to the common types of statistical analysis.
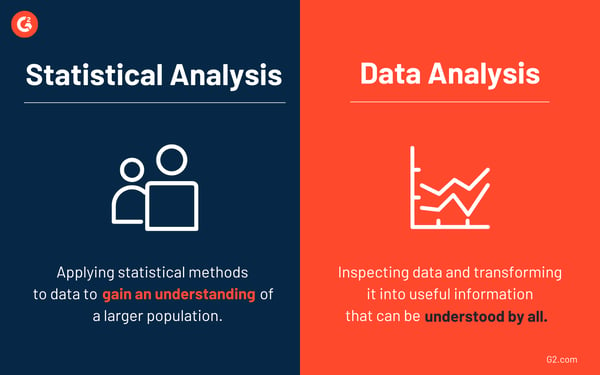
Statistical analysis applies specific statistical methods to a sample of data to have an understanding of the total population. It allows for conclusions to be drawn about specific markets, cohorts, and a general grouping to potentially predict the behavior and characteristics of others.
Data analysis is the process of inspecting and cleaning all available data and transforming it into useful information that can be understood by non-technical individuals. This is crucial when you consider that data can be meaningless if it isn’t understood by those who make decisions.
Data analysis can be used as an input to perform statistical analysis, as data from varying sources can be combined as a way to carry out the statistical process.
What are the types of statistical analysis?
When applying statistical analysis to your business, the two main types you’ll use are descriptive and inferential. However, there are other types that many businesses also use, depending on the overall goal or question the organization is looking to answer.
Descriptive statistical analysis
Descriptive analysis creates simple reports and graphs using data visualization software that allows companies to understand what happened at a particular point. It’s important to note that descriptive analysis only pertains to events that happened in the past.
The actual data that’s part of descriptive analytics focuses on answering “what happened” in a way that takes a deep dive into past data.
As the name suggests, it’s used to describe the basic features of past information and summarizes it in an easy and rational way. It’s important to keep in mind that this type of statistical analysis isn’t used to draw conclusions. You can only describe what something is and what the data from the past represents.
For example, a business may use descriptive statistical analysis to take a look at your company’s traffic throughout the past year. You can see things like when traffic fell, when it picked back up, which month had the most traffic, and the average traffic of each month. However, this data doesn’t tell you why traffic fell.
Descriptive statistical analysis only describes the data or summarizes the information surrounding the data. It’s still important to understand your data in a meaningful way.
To sum it up, the goals of descriptive analysis are:
- Describe data in a visual manner
- Explain what the data presents
Inferential statistical analysis
While descriptive statistics has a limitation that it only allows for broader assumptions about the data, objects, or people you measure, inferential statistical analysis can solve that limitation.
Inferential statistics is the result of more complicated and mathematical estimations. It allows users to infer or conclude trends about a larger population based on the samples that are analyzed. Essentially, it takes data from a sample and then makes conclusions about a larger population or group.
Inferential statistical analysis is often used to study the relationship between variables within a sample, allowing for conclusions and generalizations that accurately represent the population. And, unlike descriptive analysis, businesses can test a hypothesis and come up with various conclusions from this data.
As an example, let’s say you want to know the favorite pizza topping of everyone in the world. Chances are you’re not going to go out and interview every single person in the entire world. Instead, you’d try to sample a representative population of people and attempt to hypothesize your results.
From a more business and realistic standpoint, maybe you want to ask every single one of your customers a question about your product or service. If you have 100,000 customers, it may be fairly difficult to poll each and every one of them. Instead, you’d go with a sample group of customers.
While this process isn’t perfect and you may find it difficult to avoid errors, it makes it simple for researchers to make reasoned inferences about the population.
The goals of inferential statistics are:
- Draw conclusions from analyzed data
- Test various hypothesis surrounding the data
Predictive analytics
When it comes to making predictions about future events your business could experience, turn to predictive analytics, which details what is likely to happen next. This analysis is based on current and historical facts and uses statistical algorithms and machine learning to define the likelihood of future trends based on historical data.
The industries that get the most out of predictive analytics are marketing companies, insurance firms, and financial services, but any business can see a massive benefit from preparing for an unpredictable future.
The purpose of predictive analytics is:
- Anticipate future events using data
- Determine the likelihood of various trends in behavior
RELATED: To take predictive analytics one step further, explore how to use business forecasting to better plan for the future and to get an edge on your competition.
Prescriptive analytics
Prescriptive analysis can be extremely complex, which is why it is not yet widely used by businesses when performing statistical analysis.
While other analytics tools can be used to draw conclusions, prescriptive analysis provides you with actual answers. A high level of machine learning usage is needed for these types of reports since they provide actions to take next. It also uses techniques such as complex event processing, graph analysis, and simulation.
When using prescriptive analytics, the objectives are:
- Answer the question, “what should be done next?”
- Narrow down the correct recommendation for a specific decision
Exploratory data analysis
Exploratory data analysis, also known as EDA, is used in a complementary form to inferential statistics. This approach focuses on identifying patterns in the data to find potential unknown relationships.
The purpose of this method is to:
- Discover new connections within data
- Check for missing data or mistakes within data collection
- Collect as much insight as possible surrounding the data set
- Review assumptions and hypotheses
Causal analysis
If your business objective is to understand and identify reasons why things happened, casual analysis is the route you should take.
No matter which industry your organization falls within, you’re bound to experience failure from time to time. Causal analysis is used to determine the reasons why failures happen and narrow down the exact root of the cause.
One example of causal analysis is in the IT field as businesses perform quality assurance on various software. This type of statistical analysis would be used to examine why specific software failed, if there was a bug, a data breach, or a DDoS attack.
The goals of causal analysis are:
- Identify key problem areas within the data
- Investigate and determine the root cause of why a failure occurred
Mechanistic analysis
Out of all of the types of statistical analysis, mechanistic analysis is the least common. However, in the sense of big data analysis and biological science, it plays a crucial role in the process.
This method consists of understanding specific changes in variables that cause other changes in other variables. It doesn’t take into consideration external influences that are outside of a business’s control, such as temperature and time. This method is used to show how things happen, rather than telling how things will occur later on, so it isn’t used to make predictions.
An example of mechanistic analysis in action is when those in biological science study viruses and inspect how various parts of the virus are affected by changes in medicine.
The purpose of mechanical analysis is:
- Understand the exact changes in variables that will lead to changes in other variables
- Make known that any data was a result of what happened when a subject was going through a specific activity
Statistical analysis example
Since statistical analysis can be a complex topic to comprehend, let’s explore a simple and real-life example.
Let’s say you own a franchise store of a popular new health and fitness gym. Since you opened its doors in 2010, you’ve seen a steady decrease in new members, as well as members canceling their contracts. You believe that one of the primary causes of the decline in both new members and contract renewals could be the recent popularity of in-home workout equipment.
To test this hypothesis, you would:
- Gather the data of the two variables in question — new members and contract renewals.
- Put this data into a software program that can run various statistical analysis methods.
- Run a linear regression test using the regression formula as your analysis model to visualize the data. Regression would be used in this case to visualize the trend in data, which would help prove the connection between the decline in members and the increased popularity of in-home workout equipment.
- Analyze the results.
Once complete, you’ll be able to see if the growing popularity of in-home workout equipment has had a negative impact on your health and fitness gym.
What is the best statistical analysis software?
When it comes to statistical analysis software, there’s a wide variety of options you can choose from. This software utilizes specialized programs designed to allow its users to perform complex statistical analysis that they’re unable to do by hand.
Statistical analysis software tools are typically used by data scientists and mathematicians but can provide industry-specific features. Each tool provides a unique set of features that your company may find to be exactly what it needed.
Here’s a look at the top ten statistical analysis software from G2’s Winter 2020 Grid® Report.
DISCLAIMER: Some reviews may be edited for clarity.
1. IBM SPSS Statistics
Coming in hot at number one is IBM SPSS Statistics, which is used to solve industry-specific business issues that assist in decision making. It provides users with specific functionality that is customizable for different skill levels while delivering graphs and reports that easily show results.
What users say:
“IBM SPSS has countless statistical tools necessary to perform my analysis as a worker. I use a lot of the crossing of variables, construction of hypothesis, percentiles, sampling, graphs, tables, and reports necessary to present analysis that comes from sociological research. With these tools I can make probabilities, predictions of events and planning of activities that benefit the communities, fulfilling my objectives as a sociological analyst and the goals in my work.
However, it was a little complicated to learn each of its tools and how to use them properly to get the results I expected at the beginning. I instructed myself in the use of IBM SPSS reading tutorials, and to this day I handle it quite skillfully, getting the analytical results I want.”
IBM SPSS Statistics review by Douglas P.
2. RStudio
RStudio is a tool created for data science and statistical computing. It helps teams of users work together, share computing resources, and publish the results for decision-makers within their organization.
What users are saying:
“Rstudio is not only an incredible graphical interface for R language, but it represents a complete user and development environment. With RStudio, it’s very easy to automatically import datasets and to navigate through source files and workspaces without writing any line of code. Plus, it allows for very efficient management of the generated plots and the command flow.
One downside is that some graphical components could be more visually appreciable with an icon restyling.”
RStudio review by Antonio Z.
3. Stata
Stata is an all-in-one tool for data management, statistical analysis, and high-quality graphics, all at your fingertips.
What users are saying:
“What I love most about Stata is that it has an easy interface, commands are well explained within the help section and online manual, and there is wide community support. It’s also easy to navigate, use the graphs for presentations, and I find that the analysis is user-friendly.
However, it can be quite challenging for new users and beginners to confidently use Stata in the research process. One needs to have in-depth knowledge, such as in graphical interpretations, and use of regression and standard errors.”
Stata review by John T.
4. JMP
JMP is a statistical analysis tool that combines powerful statistics with dynamic graphics, in memory and on the desktop. Its interactive and visual paradigm enables it to reveal insights that are impossible to gain from raw tables of numbers or static graphs.
What users are saying:
“JMP is packed with tons of features that can help solve statistical problems in your industry. It has an easy to use interface that guides users through the process of performing the analysis. It has plenty of guide material that can help users do a more in-depth analysis of quality processes.
The only thing I dislike is the price point. There is other software that comes at a cheaper price. But, if you’re looking to invest that extra money, you do get tons of advantages with it.”
JMP review by Rishi R.
5. Minitab 18
Minitab 18 is statistical software that gives users the tools needed to analyze data and find meaningful solutions to tough business problems. From seamless data preparation to effortless presentations, there’s a lot to discover.
What users are saying:
“Minitab 18 has an incredible user interface. It is very easy to locate and use tools based on their categorizations. The Help feature is also great. You’re able to simply right click and choose Help on any feature and are brought to a step-by-step breakdown of the feature. On the downside, some features are not as intuitive as they could be. It should be easier to get rid of graphs and data so as not to clog up the UI so much.”
Minitab 18 review by Mike C.
6. KNIME Analytics Platform
KNIME Analytics Platform works to be an open solution for data-driven innovation, helping users discover the potential hidden in data, mine for fresh insights, or predict new futures. It boasts more than 2,000 modules, hundreds of ready-to-run examples, and a comprehensive range of integrated tools.
What users are saying:
“The program offers workflow checks, statistical and mathematical functions, algorithms for machine learning and sophisticated prediction algorithms. KNIME is extremely helpful in evaluating big quantities of information with sophisticated algorithms and codes without programming since it utilizes block modules to accomplish graphical jobs.
One downside is that it uses a bunch of memory on your desktop, which impacts the machine’s general efficiency.”
KNIME Analytics Platform review by Betty E.
7. OriginPro
OriginPro is a user-friendly and easy-to-learn software application that provides data analysis and publication-quality graphing capabilities tailored to the needs of scientists and engineers. Those who use OriginPro can customize operations such as importing, graphing and analysis, all from the GUI. Graphs, analysis results, and reports update automatically when data or parameters change.
What users are saying:
“Customer service is easily the best part of Origin. They are speedy and very helpful. The graphics that you can make are very professional, and always very aesthetically pleasing. Plus, you can do so much on one platform. I use it to analyze a variety of data and I never feel limited. The only thing is that there is a learning curve that is difficult to get over. If you’re willing to spend time with it, you will thank yourself later.”
OriginPro review by Louis C.
8. NumXL
What makes NumXL different is that it’s a suite of time series Excel add-ins, which transforms Microsoft Excel into a first-class time series software and econometrics tool, offering statistical accuracy as it integrates with Excel adding a variety of econometric functions, a rich set of shortcuts, and intuitive user interfaces to guide you through the entire process.
What users are saying:
“Very easy to work with, especially being a simple add-on in Excel. I can easily seasonally adjust all data, forecast, and more. The customer support is one of the best I have ever experienced, which has been a huge benefit. I have reached out with questions late on Sunday evenings and have gotten them answered immediately. Now that is customer support! There’s nothing about NumXL I don’t like.”
NumXL review by Calen C.
9. SAS/STAT
SAS/STAT offers users exact techniques for small data sets, high-performance statistical modeling tools for large data tasks and modern methods for analyzing data with missing values. Users will also experience regular updates, a variety of ready-to-use statistical procedures, and a range of statistical methods.
What users are saying:
“I appreciate the good balance of being able to write code and being able to use packages and macros when I don’t have time to write detailed code. What I dislike is that there aren’t enough help options available when one has questions about how to code for various statistical equations.”
SAS/STAT review by Braden T.
10. SAS Base
SAS Base is a programming language software that provides a web-based programming interface. It offers ready-to-use programs for data manipulation, information storage and retrieval, descriptive statistics, and reporting. This powerful data analysis tool also provides cross-platform and multi-platform support.
What users are saying:
“SAS Base is extremely streamlined and not much in the way of frills. You set up your data, write your code, run it, and then view the output or pass it to another program for further analysis. It does this quickly and efficiently once you have everything set up properly. However, it can be a bit clunky to use – it feels somewhat dated as far as the interface is concerned and has a relatively steep learning curve.”
SAS Base review by Erik G.
DISCOVER: If you’re interested in a different statistical analysis software not included on this list, check out other options and read the real and unbiased reviews left by your peers.
Take a data deep dive
When your business is looking to evaluate models and formulas to find the relationship between variables, turn to statistical analysis. These methods are already being used in almost every field, so there’s no better time than now to analyze business data in new and exciting ways.
No amount of data is too vast, especially with the endless amount that you can discover from it. Learn even more about what you can do with your data when you uncover the ins and outs of data mining.