
XLM Price Analysis – February 29
The Stellar (XLM) experiences a notable downward trend and thereby loses support from the imminent moving averages.
XLM/USD Market
Key Levels:
Resistance levels: $0.067, $0.069, $0.071
Support levels: $0.047, $0.045, $0.043
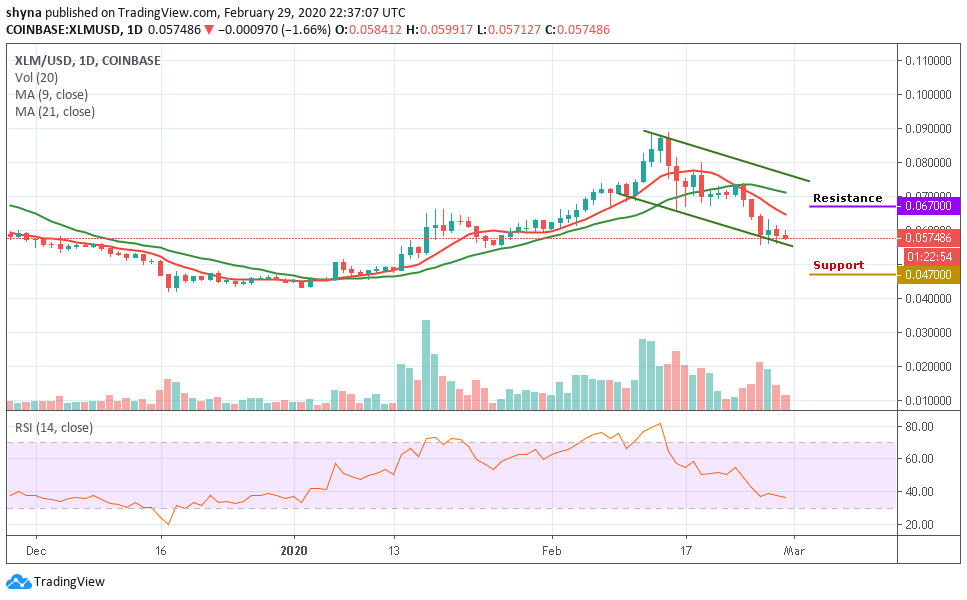
Looking at the daily chart, the XLM/USD pair continued to maintain a downward trend in the long run. For the moment, the market is down by 1.66%. The price of Stellar will continue to fall as long as the selling pressure remains on the market. For now, the $0.053 is serving support for the market.
Looking at the daily chart, Stellar is currently following a downward trend and about to cross below the trend line. Considering a northward movement, the amounts of $0.067, $0.069 and $0.071 could constitute resistance for the market. Alternatively, a movement toward the south may bring support down to $0.047, $0.045, and $0.043 while the RSI (14) continues to move down below the 40-level.
XLM/BTC Market
Comparing with Bitcoin, the pair is still trading on the downside and is currently trading at the 667 SAT. If the bulls couldn’t push the price above the 9-day and 21-day moving averages, the stellar price may likely see a sharp drop at 600 SAT support level. Breaking below this level could further drag the market to other support levels at 585 SAT and below.
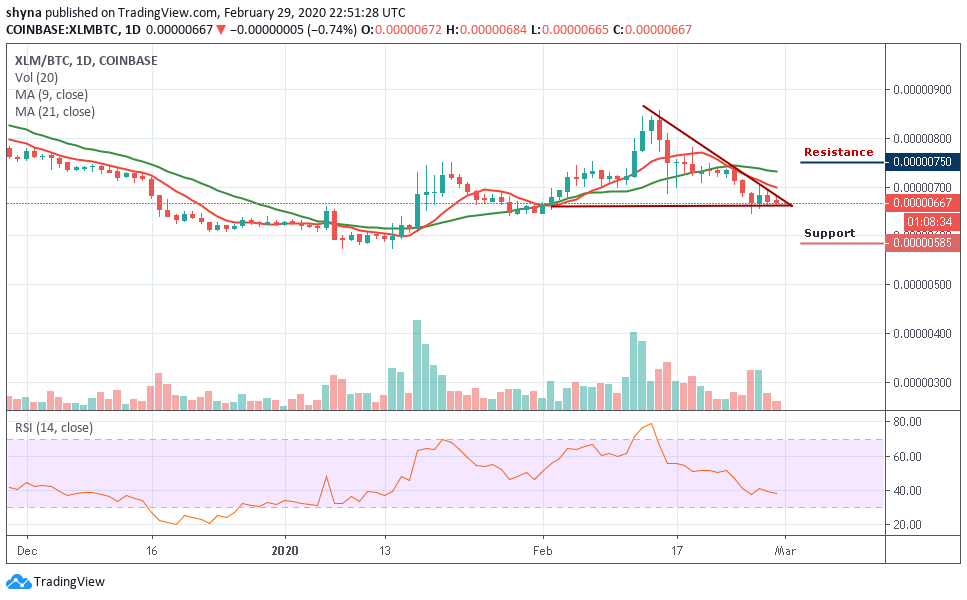
Moreover, as the RSI (14) is moving in the same direction around 40-level, the market may start moving in sideways. However, XLM is a result-oriented coin and it has also shown great potential in the past. Therefore, the recovery is on the go and in no time, we may see Stellar coming out strong.
Please note: Cryptovibes.com is not a financial advisor. Do your research before investing your funds in any financial asset or presented product or event. We are not responsible for your investing results.
