
This article is for investors who would like to improve their understanding of price to earnings ratios (P/E ratios). We’ll show how you can use Kyung Dong Pharmaceutical Co., Ltd.’s (KOSDAQ:011040) P/E ratio to inform your assessment of the investment opportunity. Looking at earnings over the last twelve months, Kyung Dong Pharmaceutical has a P/E ratio of 33.27. That is equivalent to an earnings yield of about 3.0%.
See our latest analysis for Kyung Dong Pharmaceutical
How Do You Calculate Kyung Dong Pharmaceutical’s P/E Ratio?
The formula for price to earnings is:
Price to Earnings Ratio = Price per Share ÷ Earnings per Share (EPS)
Or for Kyung Dong Pharmaceutical:
P/E of 33.27 = KRW8080.00 ÷ KRW242.83 (Based on the trailing twelve months to September 2019.)
Is A High Price-to-Earnings Ratio Good?
A higher P/E ratio implies that investors pay a higher price for the earning power of the business. All else being equal, it’s better to pay a low price — but as Warren Buffett said, ‘It’s far better to buy a wonderful company at a fair price than a fair company at a wonderful price’.
How Does Kyung Dong Pharmaceutical’s P/E Ratio Compare To Its Peers?
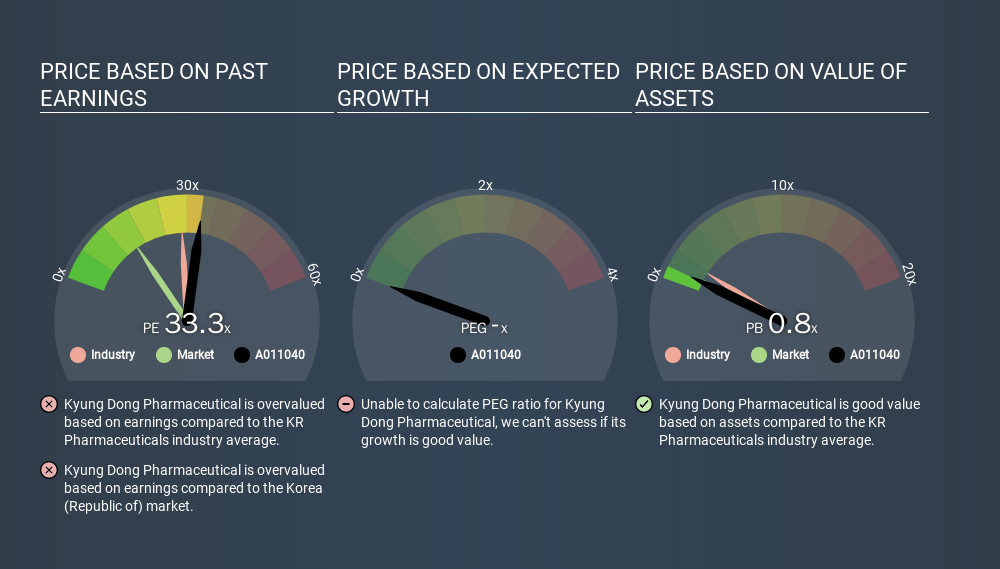
One good way to get a quick read on what market participants expect of a company is to look at its P/E ratio. The image below shows that Kyung Dong Pharmaceutical has a higher P/E than the average (28.6) P/E for companies in the pharmaceuticals industry.
Kyung Dong Pharmaceutical’s P/E tells us that market participants think the company will perform better than its industry peers, going forward. Clearly the market expects growth, but it isn’t guaranteed. So further research is always essential. I often monitor director buying and selling.
How Growth Rates Impact P/E Ratios
Companies that shrink earnings per share quickly will rapidly decrease the ‘E’ in the equation. That means unless the share price falls, the P/E will increase in a few years. Then, a higher P/E might scare off shareholders, pushing the share price down.
Kyung Dong Pharmaceutical saw earnings per share decrease by 66% last year. And it has shrunk its earnings per share by 25% per year over the last five years. This growth rate might warrant a below average P/E ratio.
A Limitation: P/E Ratios Ignore Debt and Cash In The Bank
It’s important to note that the P/E ratio considers the market capitalization, not the enterprise value. So it won’t reflect the advantage of cash, or disadvantage of debt. Hypothetically, a company could reduce its future P/E ratio by spending its cash (or taking on debt) to achieve higher earnings.
Such expenditure might be good or bad, in the long term, but the point here is that the balance sheet is not reflected by this ratio.
How Does Kyung Dong Pharmaceutical’s Debt Impact Its P/E Ratio?
With net cash of ₩75b, Kyung Dong Pharmaceutical has a very strong balance sheet, which may be important for its business. Having said that, at 39% of its market capitalization the cash hoard would contribute towards a higher P/E ratio.
The Bottom Line On Kyung Dong Pharmaceutical’s P/E Ratio
Kyung Dong Pharmaceutical’s P/E is 33.3 which is above average (15.4) in its market. The recent drop in earnings per share would make some investors cautious, but the net cash position means the company has time to improve: and the high P/E suggests the market thinks it will.
Investors should be looking to buy stocks that the market is wrong about. If the reality for a company is better than it expects, you can make money by buying and holding for the long term. Although we don’t have analyst forecasts you might want to assess this data-rich visualization of earnings, revenue and cash flow.
Of course, you might find a fantastic investment by looking at a few good candidates. So take a peek at this free list of companies with modest (or no) debt, trading on a P/E below 20.
If you spot an error that warrants correction, please contact the editor at [email protected]. This article by Simply Wall St is general in nature. It does not constitute a recommendation to buy or sell any stock, and does not take account of your objectives, or your financial situation. Simply Wall St has no position in the stocks mentioned.
We aim to bring you long-term focused research analysis driven by fundamental data. Note that our analysis may not factor in the latest price-sensitive company announcements or qualitative material. Thank you for reading.
Discounted cash flow calculation for every stock
Simply Wall St does a detailed discounted cash flow calculation every 6 hours for every stock on the market, so if you want to find the intrinsic value of any company just search here. It’s FREE.
