
XLM Price Analysis – January 31
The bears could step back into the market as traders may consider selling with bearish candle reversal pattern as confirmation.
XLM/USD Market
Key Levels:
Resistance levels: $0.068, $0.070, $0.072
Support levels: $0.053, $0.051, $0.049
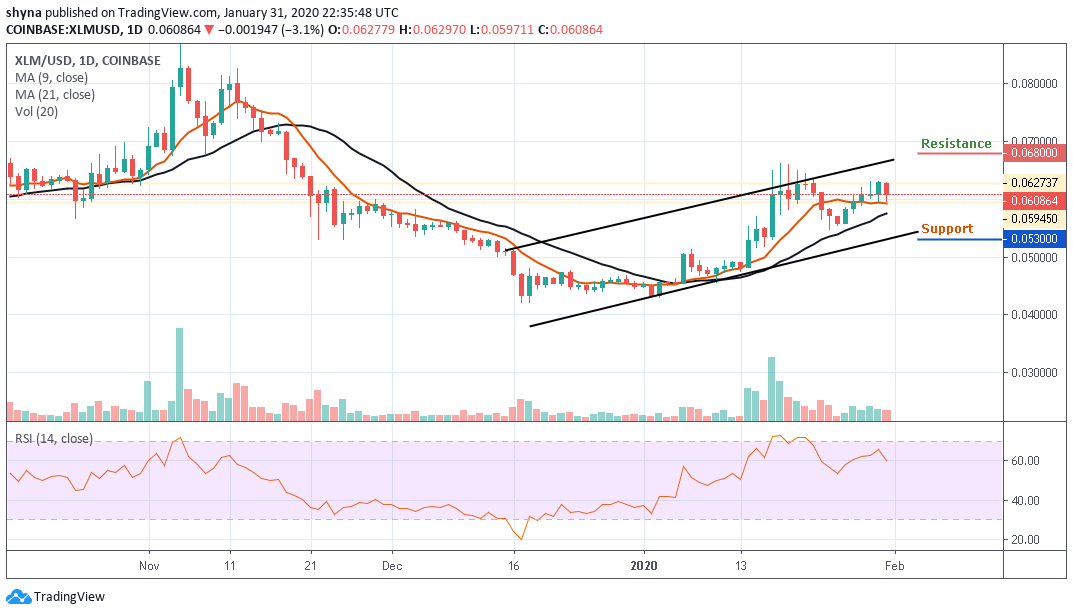
Today, the XLM coin opened at $0.0627, and after a mild low swing, it reached $0.0594. Facing a rejection above, Stellar pulled back and tried to strike a rebound at $0.0610, but couldn’t, due to market bull, presumably. XLM/USD has resumed the fall today also and has recently bottomed at $0.0558. The crypto coin is hustling to start a robust price recovery, but, it seems, it is still facing hurdles.
Looking at the daily chart, Stellar is currently trading in a red candle and about to cross below the 9-day moving average, with a potential surge of volatility. Considering a northward movement, the amounts of $0.068, $0.070 and $0.072 could constitute resistance for the market. Alternatively, a movement toward the south could bring support down to $0.053, $0.051, and $0.049, while the RSI (14) is about to move below the 60-level.
XLM/BTC Market
Against BTC, the market is seen to be moving below the 9-day and 21-day moving averages within the ascending wedge channel where the price is expected to be broken down as revealed in the daily chart. However, should the price break below the lower boundary of the channel, then, the market may experience a downward trend that may likely touch the nearest support level of 600 SAT and below.
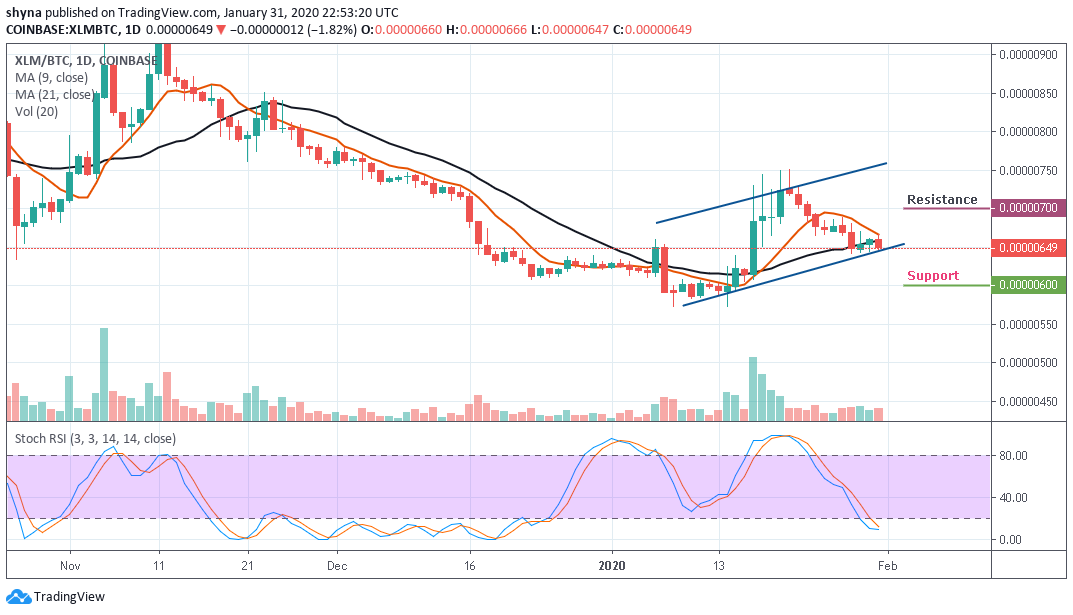
Nevertheless, if the XLM price crosses above the moving averages of 9 days and 21 days, the coin is expected to reach the resistance at 700 SAT and 750 SAT price levels. The stochastic RSI indicator confirms that the market is coming out of the oversold zone which may likely give some bullish signals in the nearest term.
Please note: Cryptovibes.com is not a financial advisor. Do your research before investing your funds in any financial asset or presented product or event. We are not responsible for your investing results.
