
For many years, W.P. Carey Inc (WPC) was one of our favorite REITs and we issued research on it frequently. It produced a 7%-plus yield alongside highly-favorable price to funds from operations (“FFO”) ratios. The market didn’t understand W.P. Carey and we reaped the benefits.
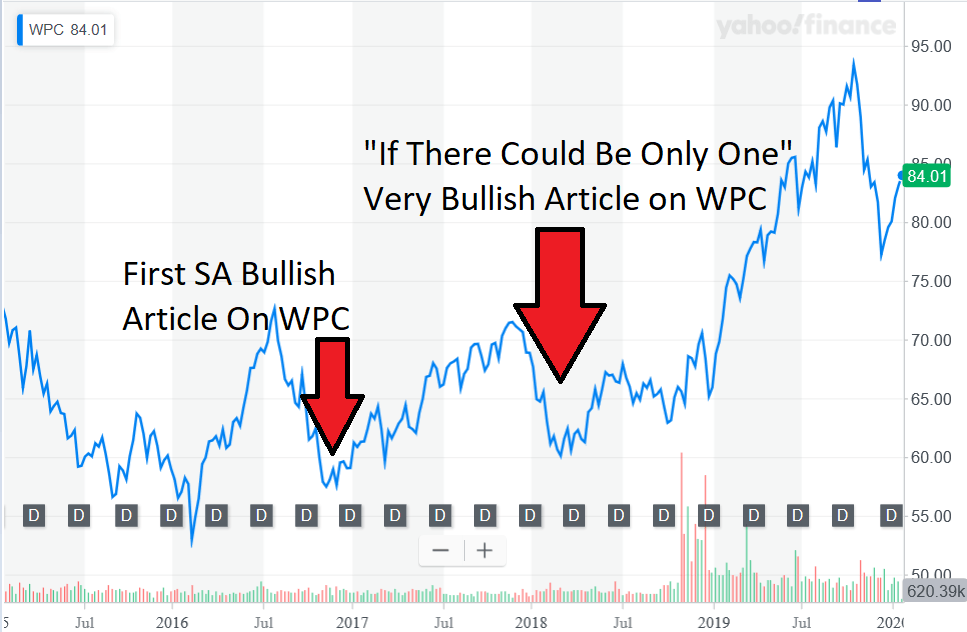
Source: Yahoo Finance and WER
Those two articles are located here and here for your reference. We do our best to be as transparent as possible so readers know authors’ track records. This is more difficult due to the “paywall” restricting access to old articles although we understand and respect why it’s in place. As a solution, we incorporate past recommendations into current articles so readers are fully aware of our past positions.
The good times didn’t last forever, however, as the market eventually recognized W.P. Carey should be trading at a 20x to 24x multiple and a 4.0% to 4.8% yield. The good ol’ days are seemingly gone.
How We Arrived (Way Up) Here
The major catalyst to the upward move in the stock price was the voluntary closure of W.P. Carey’s private capital business division. This happened in mid 2017 after years of upper management trying to convince skeptical analysts that this division was accretive. The private capital business raised funds from high net worth investors to build large portfolios of net lease real estate.
W.P. Carey tended to buy these portfolios and integrate them into the publicly-traded vehicle WPC. Since W.P. Carey built and managed these portfolios, they knew precisely how the assets were performing and presumably what their intrinsic value was. We are not fans of affiliated transactions (that’s an understatement), but W.P. Carey did these transactions as well as they could have from a corporate governance perspective and both private and public shareholders were generally pleased with the results. The assets have done well so it’s safe to say that WPC has benefited at least proportionately. Even Seeking Alpha covered some of these buyout transactions as shown here more recently.
The public markets utterly failed to see how the closure of the private arm would impact WPC’s valuation. WPC’s peers were trading at a full 5x higher FFO multiple due to the “complexity tax” of its non-traditional business. The stock eventually responded and skyrocketed by more than 55% in less than 24 months. This was unusually predictable, hence our atypically bold “If There Could Only Be One REIT” article title, and our followers (and portfolio managers) benefited. I, WER’s lead portfolio manager, personally sold most of my WPC stock in the mid to high-$80s.
It’s time to re-investigate this top tier REIT and determine what it’s currently worth.
The Fundamentals Always Matter
W.P. Carey is among the top 20 REITs and included in every major diversified REIT index. It’s one of the most diversified with exposure to more than five major property types and ensures no tenant or industry is over representative in the portfolio. The firm has been around since the early 1970s meaning it has navigated numerous market cycles. W.P. Carey maintains established asset management teams in both the U.S. and Europe which also is unique. The firm has consistently maintained a strong balance sheet, diversified borrowing base, and investment grade credit ratings.

Source: WPC Q3 Report
Notice the private investment vehicles listed on the right including the CPA and Carey Watermark portfolios. These remain private and owned by individual investors but provide fee revenue to the publicly-traded REIT. In this sense, WPC is still differentiated vs. its publicly-traded peers.
Much of WPC’s assets are derived from older CPA programs which were integrated into the public vehicle. The most recent merger involved CPA 17 resulting in a significantly larger asset base with minimal impact to G&A (we measured this as discussed later). W.P. Carey has a history of achieving those results and the numbers demonstrate it. As an example, the firm reduced G&A expense by 30% between 2015 and 2017. Even as one of the better run internally managed REITs, that’s a rare and impressive feat. Realty Income achieved similar operational improvements albeit over a slightly longer period.
W.P. Carey Real Estate and Portfolio Metrics
Generating more than $1.1 billion in annual base rent (“ABR”) W.P. Carey’s portfolio is extremely healthy with 98.4% occupancy. A powerful tailwind is W.P. Carey’s ability to structure 99% of leases with contractual rent increases, over half (62% as of the end of Q3) are tied to the Consumer Price Index (“CPI”). How does W.P. Carey generate such consistent results despite its complicated asset base? Underwriting.
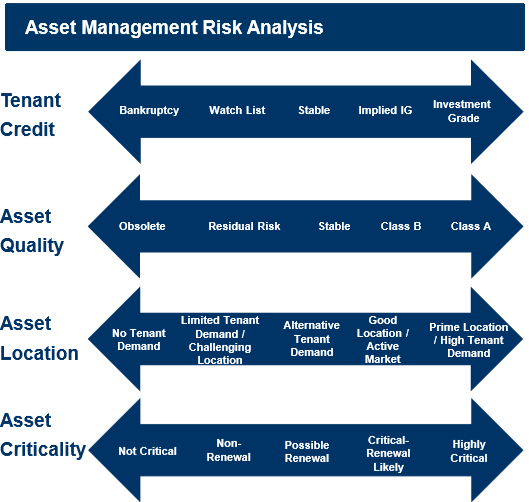
Source: WPC Q3 Report
First, W.P. Carey sticks to net lease properties. Second, it performs its own due diligence from an equity and credit perspective and maintains very high standards throughout market cycles. Third, W.P. Carey focuses on “mission critical” assets it considers essential to a tenant’s operational integrity. Many firms claim to buy primarily “mission critical” assets but W.P. Carey actually does. Fourth, the firm only engages when it can structure a lease term to its liking, always including contractual rent bumps and usually attaching them to CPI. Lastly, they never put all their eggs in one basket. In fact, they rarely put even a few eggs in the same basket.
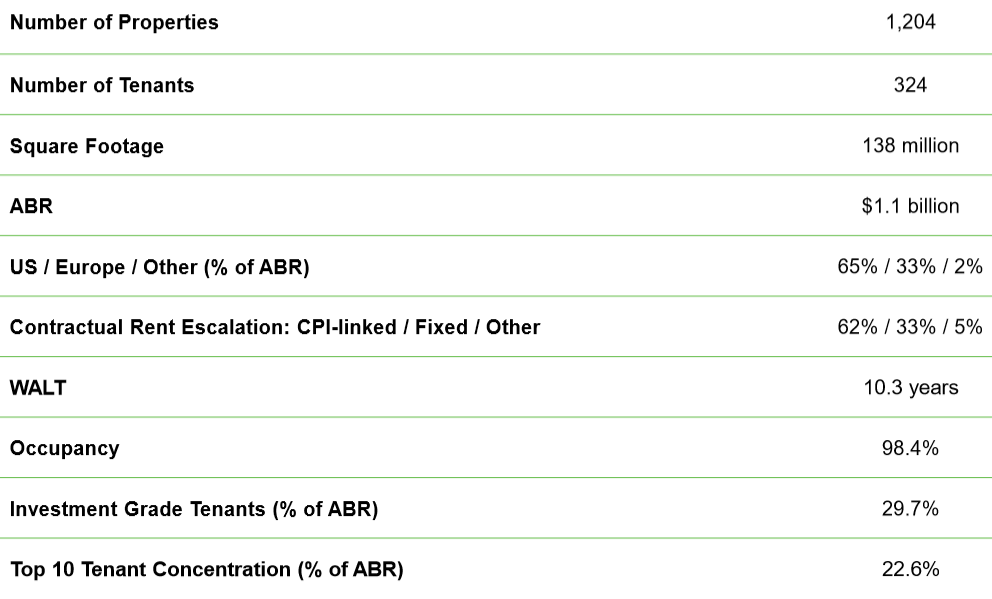
Source: WPC Q3 Report
We’ve mentioned the first few stats but note the lengthy weighted average lease term (“WALT”) of 10.3 years. W.P. Carey has more than a decade of rent increases “in the books” today. This makes it much easier for management and the board to determine a reliable distribution policy. This is yet another reason why we concluded the market was incorrect (e.g. too cheap valuation) regarding W.P. Carey for all those years.
I want to touch on the investment grade tenant concentration as it may seem low at first glance. Only public companies are able to earn investment grade credit ratings and there are relatively few vs. private organizations. This trend has accelerated with increased regulation at the public level coupled with more institutions willing to invest in private equity.
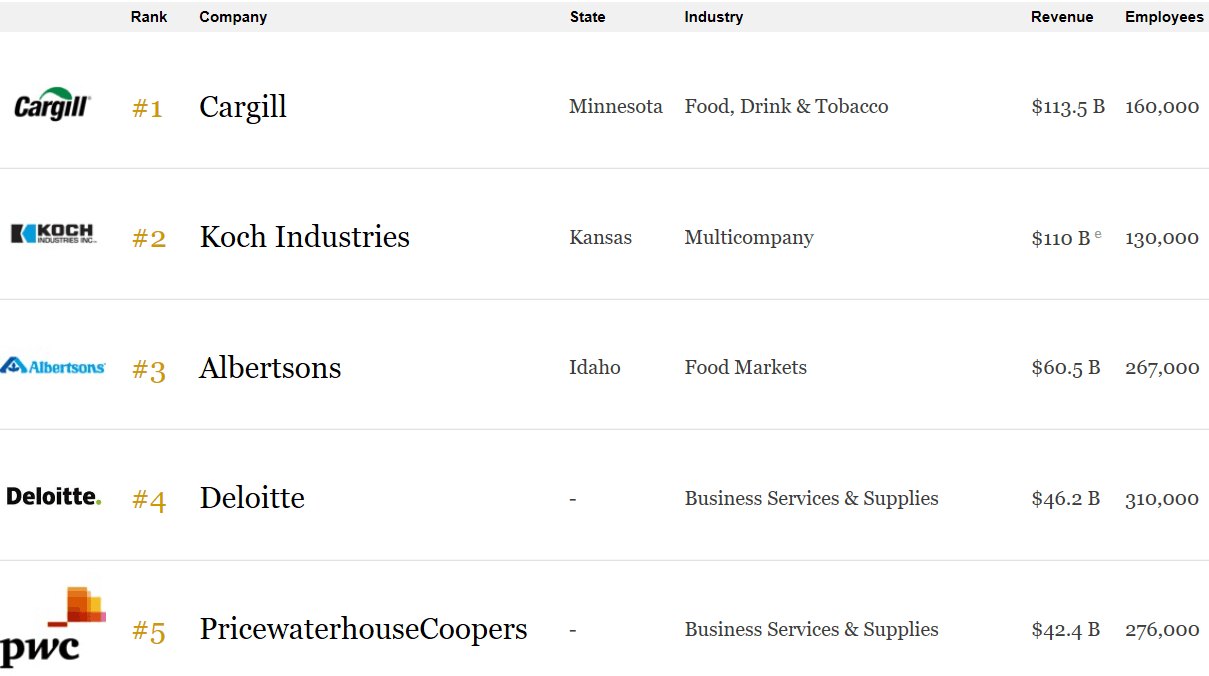
Source: Forbes. Top U.S. Private Companies by Revenue
As a result, it’s rare to see a large, diversified REIT with more than 25% of leases backed by investment-grade credit ratings. The proportion of publicly-traded companies is simply too low. More focused REITs can achieve a higher percentage in this category through leasing mainly to the likes of Walgreens (WBA) and Autozone (AZO), both of which are at the bottom of investment grade at BBB. This is a good time to compare W.P. Carey’s portfolio to a name we all know and many love: Realty Income (O).
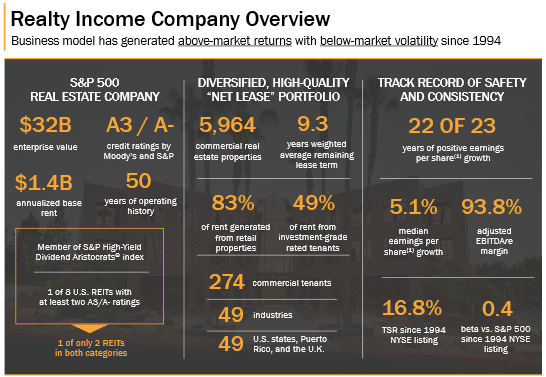
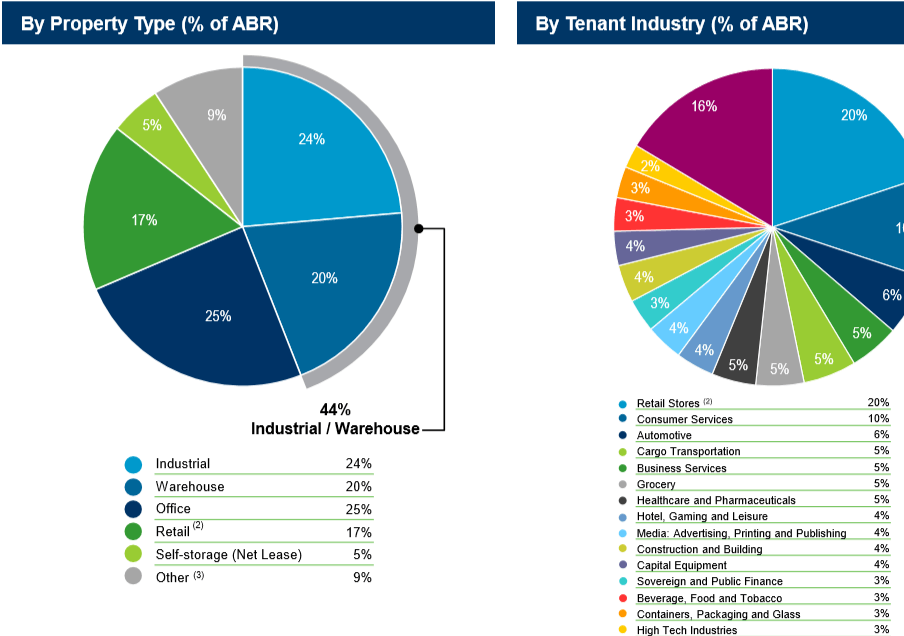
Source: Realty Income Q3 Report
Realty Income’s No. 1 tenant is none other than Walgreens at 5.7% of the portfolio. It also has the highest percentage of investment grade tenants I’m aware of in this sector at 49%. Realty Income has significantly fewer tenants than W.P. Carey with similar industry exposures, but in reality it’s much less diversified as 83% of Realty Income’s rent is derived from retail.
Source: WPC Q3 Report
W.P. Carey has only 17% of its base ABR derived from retail properties with Industrial the highest at 24%. Realty Income’s 9.3 years weighted average lease term is excellent but not as solid as W.P. Carey’s 10.3 years.
Source: WPC Q3 Report
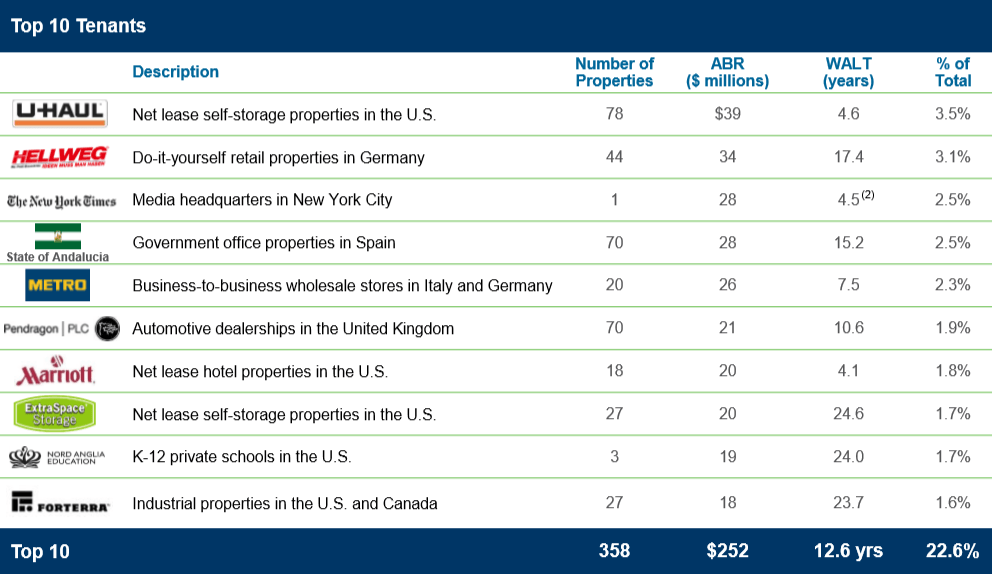
W.P. Carey’s exposure to its top 10 tenants is industry leading at less than a quarter of the portfolio (22.6%). Realty Income’s comparable exposure is much higher at 54%. The concentration of Realty Income’s top 15 tenants looks even worse at 46.6% (54% is indeed higher than 46% but the relative concentration is worse in our opinion).
Outside of the New York Times’ headquarters, W.P. Carey doesn’t really do “sexy.” It gets the job done leasing to mundane businesses needed to make the world go round including transportation companies, B2B wholesale stores, mid-level hotels, schools, industrial properties, and government offices.
Source: WPC Q3 Report
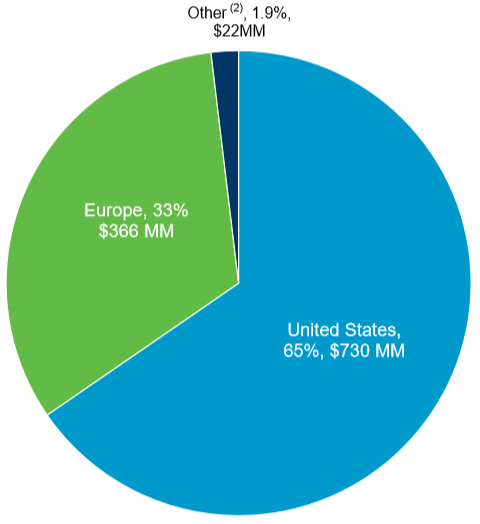
W.P. Carey maintains higher international exposure compared to other REITs. As someone actively performing due diligence on international real estate funds, I understand W.P. Carey’s interest in Western Europe, particularly the U.K. and “satellite” nations like Poland. Interest and cap rates function differently in those markets relative to the U.S. creating opportunities to augment a U.S.-centric portfolio.
Realty Income has generated better earnings growth but that’s no surprise given its effectively unmatched track record in this capacity. Investors could consider W.P. Carey lower risk than Realty Income based on portfolio structure, however, which is quite the accomplishment given Realty Income’s pristine reputation.
W.P Carey Key Financial Metrics
Source: WPC Q3 Report
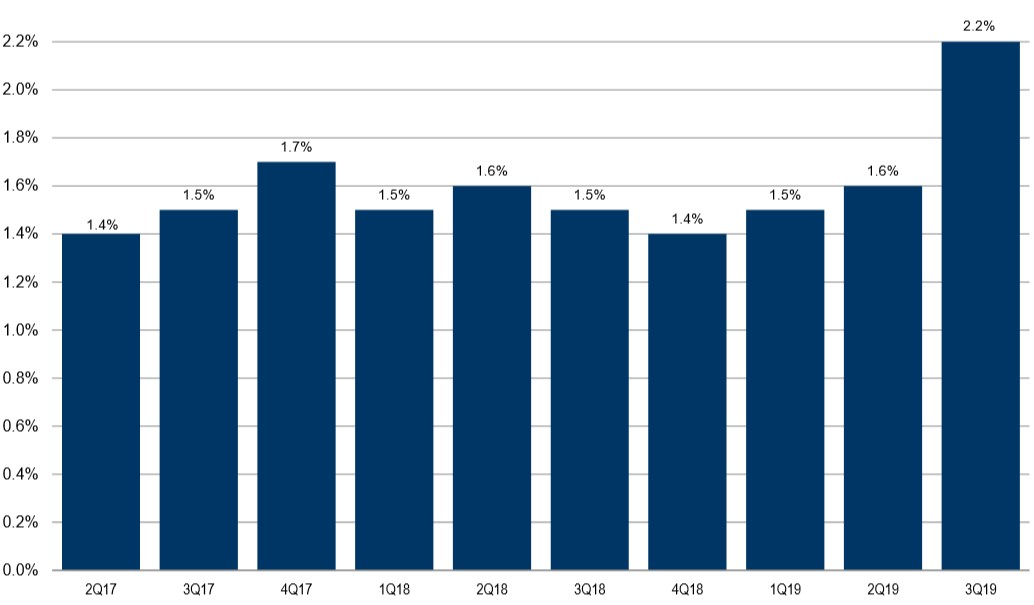
This chart shows same-store annual base rent over the last few years. Slow and steady wins the race. These rent increases, coupled with improving operational efficiency, have resulted in strong dividend growth over time. Many, if not most, REITs we follow have struggled to increase rents meaningfully in recent quarters with multi-family being an exception. W.P. Carey, however, posted its highest rent increase in many years in Q3 2019.
Source: WPC Q3 Report
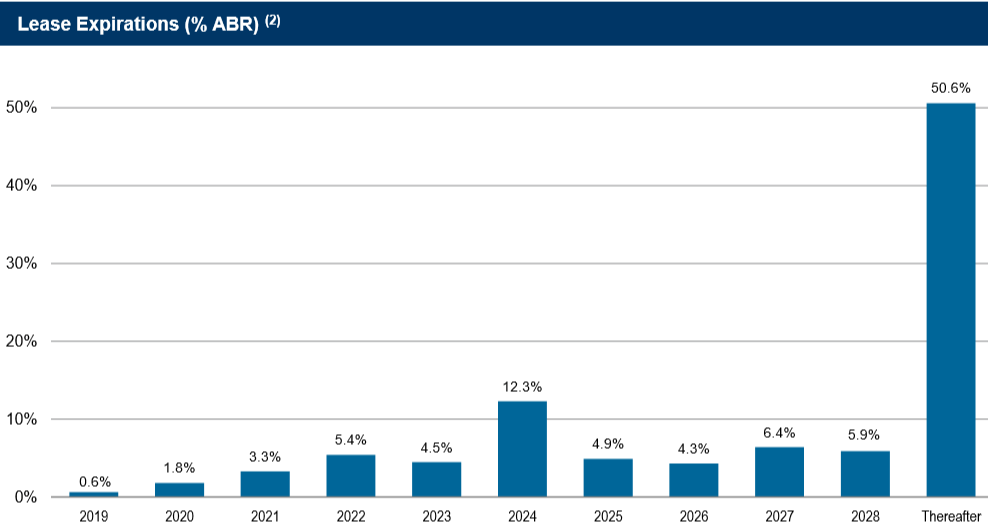
In addition, the cash flow engine is structured to deliver for many, many years with over half of W.P. Carey’s lease income expiring after 2028.
Balance Sheet
Source: WPC Q3 Report
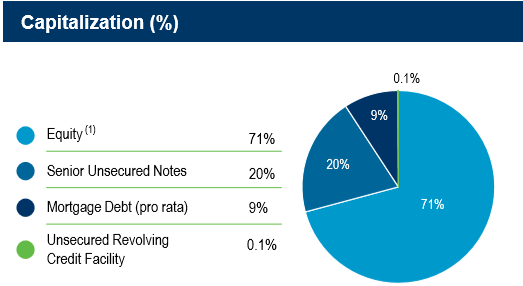
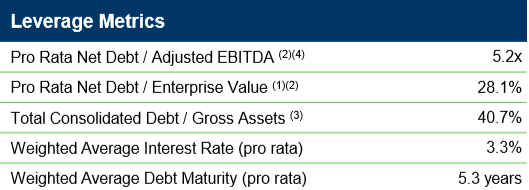
W.P. Carey is well capitalized with approximately 29% net debt and the vast majority of its liabilities in the form of low-cost unsecured notes. Enterprise value at the end of Q3 was $21.4 billion.
Source: Realty Income Q3 Report
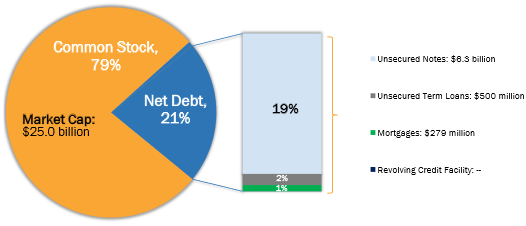
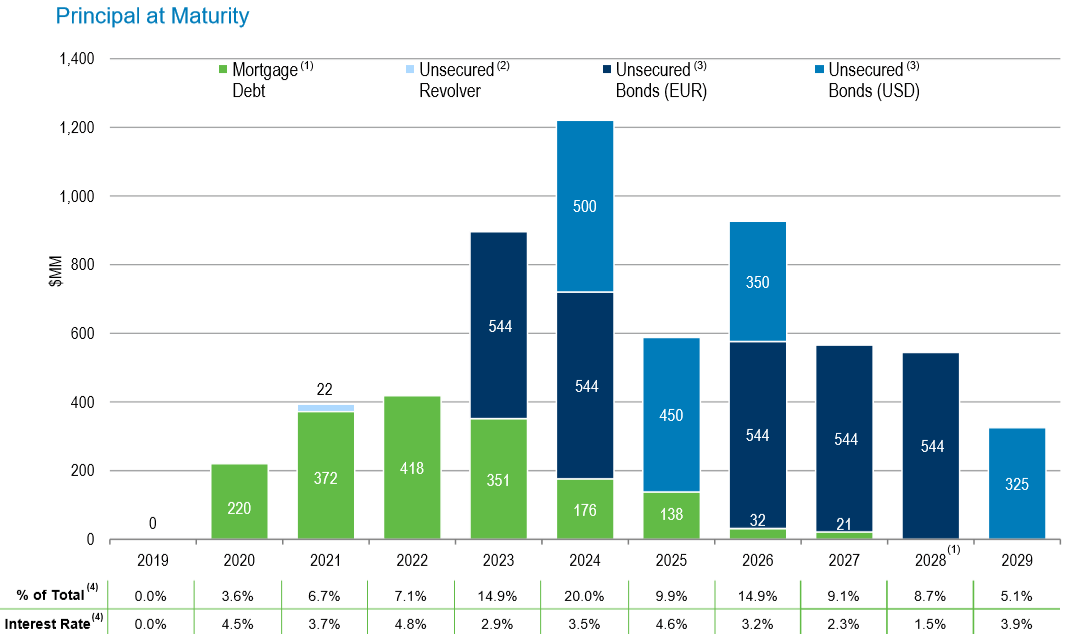
Notice a near identical capital stack at Realty Income despite the different business models. W.P. Carey has a completely untapped credit facility at its disposal and has optimized its borrowing through a mix of low cost USD and EUR notes. Tying EUR debt to EUR-based properties mitigates most currency risk without the cost or complexity of currency hedging.
Source: WPC Q3 Report
Leverage of 5.2x is not the best in the industry but better than average and Realty Income based on trailing twelve month data. W.P. seemingly agrees with us as they’ve consistently reduced leverage in recent quarters. Part of the reason management is willing to have 5.0-5.25x leverage instead of an “ideal” 4.5-5.0x is due to interest rates and W.P. Carey’s skill in structuring its liabilities. Realty Income pays an weighted average interest expense of 3.9% which is impressive. W.P. Carey, however, is subject to an industry-leading 3.3%. This is due to carefully incorporating EUR denominated debt and taking on more short- and medium-term debt than some peers. W.P. Carey’s 5.3 weighted average debt maturity is a good ways from Realty Income’s 7.9 years, for example.
Source: WPC Q3 Report
Due to these factors, Carey’s fixed-charge coverage ratio is near all-time lows despite carrying a slightly higher net debt to EBITDA ratio than we’d prefer.

Source: WPC Q3 Report
This gives W.P. Carey tremendous flexibility in a downturn. In fact, it’s positioned to be an aggressive buyer of assets during a real estate correction without materially risking its industry-leading investment grade credit rating.
W.P. Carey Dividend
Federal Realty Trust (FRT) is the only REIT currently included in the S&P 500 Dividends Aristocrat Index. Realty Income and Tanger Factory Outlets (SKT) and are members of the S&P High Yield Dividend Aristocrats index. Tanger has been the No. 1 holding for most of the last few years.
Source: WPC Q3 Report
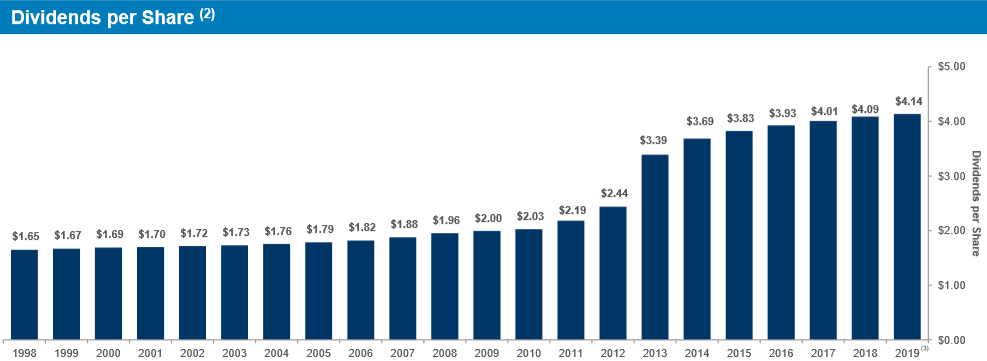
Provided it’s able to increase distributions for another two years, W.P. Carey will join Federal Realty Trust in the esteemed S&P 500 Dividends Aristocrat Index. In total, 57 companies currently meet the requirements.
Adjusted Funds From Operations (“AFFO”) was $5.39 in 2018 vs. dividends paid of $4.13 or a 77% payout ratio. On a FFO basis, the payout ratio climbs to 91.5% which is the highest figure in the last five years. 2015 through 2018 saw full-year payout ratios of 80-87%.
Additional Risks and Considerations
There always are concerns no matter how solid a company. W.P. Carey has experienced approximately 13% capital gains in the last year but is up nearly 42% since Q1 2018.
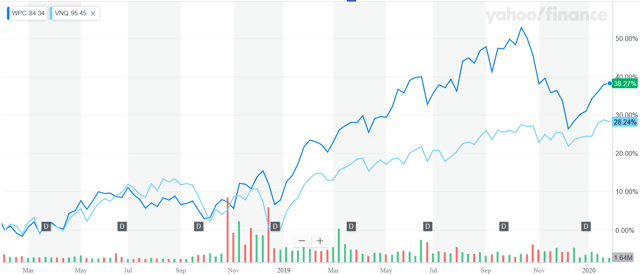
Source: Yahoo Finance
Relative to the Vanguard Real Estate Index Fund ETF Shares (VNQ), which is a good comparison given WPC’s diversified nature, the stock is still outperforming the index by more than 10% in the last two years. Historically, WPC has returned closer to a more modest 5% greater total annualized return vs. the index.
Associated with this out-performance is the market’s enthusiastic reaction to the closure of the private capital business. This may already be fading, particularly when they realize it has likely contributed, albeit marginally, to a tighter distribution coverage. If the market were to decide W.P. Carey deserves to trade back to where it used to from a multiple perspective, investors are looking at a material pullback of 15-20%. WPC’s 5.0% yield won’t offer much comfort in that situation.
Source: Yahoo! Finance
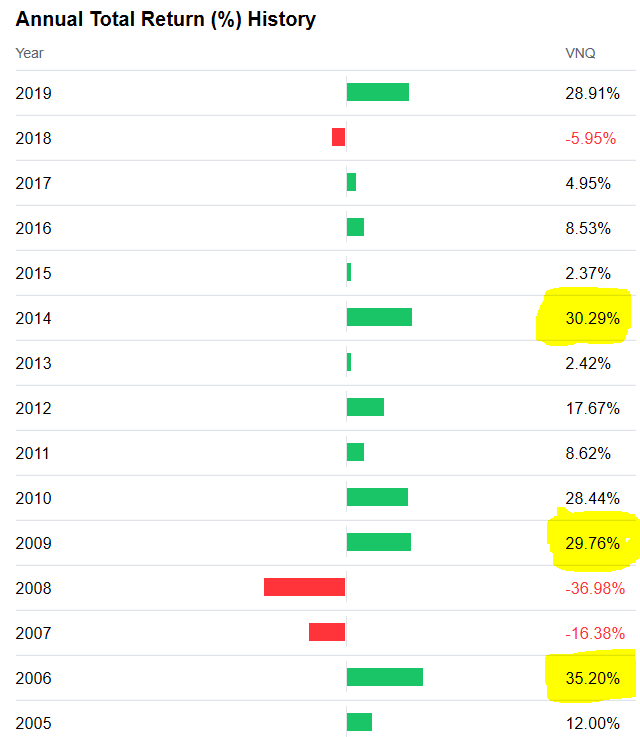
REITs in general had an unusually strong 2019 as shown in the previous chart. In fact, we highlighted the only years since 2005 that had greater performance than 2019. Not many. While rates appear to be staying low for the foreseeable future, REITs tend to have a very (25%+) strong year followed by a few mediocre years. Another fact investors should be aware of: There has only been one down year (-5.95% in 2018) for the index since the Great Recession.
That kind of performance is tough to maintain, even for REITs which tend to perform consistently due to their hard asset and income focus. W.P. Carey is a great REIT but it will pay the piper alongside the broader index when, not if, REIT valuations decline back to historical averages.
Specific to W.P. Carey, its FFO payout ratio and rents have struggled in the past 24 to 48 months. These factors are connected. W.P. Carey will eventually initiate the “$0.01 Dividend Increase” strategy if it can’t get its payout ratio down or rents up. Its portfolio’s income is much more secure than the average REIT due to its lease structures, but 2% a year increases won’t translate into exceptional dividend growth, all other things equal. If there’s even a quiet mention of a distribution cut or freeze, which we do not expect, WPC will likely return to the $60s and $70s where it traded for the better part of the last decade. This could occur if WPC makes an incorrect judgment call and ends up pushing the FFO payout ratio above 95%.
Conclusion and Valuation
W.P. Carey has among if not the lowest cost of capital of the entire REIT industry. Unsurprisingly, it’s tied with five other REITs for the highest investment grade credit rating. We’ve all seen the retail bloodbath stocks like Tanger and Simon Property Group (SPG) have experienced, much less weaker names like Washington Prime Group (WPG).
W.P. Carey has minimal retail exposure (<20%). The firm also incorporates a much greater degree of contractual rent increases than effectively all its peers, augmenting dividend reliability and increase potential. For long-term investors, the likely inclusion of W.P. Carey in the Dividends Aristocrat Index in 2023 will surely boost its reputation and attractiveness. The REIT boasts one of the most diversified portfolios in the business with consistent and conservative lease underwriting as an added bonus.
WPC’s dividend growth slowed as the firm used proceeds to pay down debt as we mentioned. On the other hand, the firm has issued more equity as the premium to NAV has spiked, allowing it to go back on a buying spree. The leases coupled with W.P. Carey’s incredibly low cost of capital all but ensures FFO growth in 2020 and beyond. The competitive advantage W.P. Carey enjoys will only grow as mortgages are paid down and presumably replaced with lower cost unsecured notes. The transition out of the asset management business should normalize results sometime this year, causing the payout ratio to decline over time.
On the negative side, the current payout ratio is relatively high and suggests only minimal increases in the next couple years. W.P. Carey has some exposure to the education sector which is a mixed bag, some are doing very well while others (see (EPR)) are having issues. As far as we can tell, W.P. Carey’s tenants are doing “OK.” There are a couple lease restructurings, but no matter how do we do the math using data in WPC’s SEC filings, the aggregate impact to FFO is 1.0% or less. W.P. Carey also has been issuing shares recently as the premium to NAV has risen abnormally compared to historical levels. We are not generally big fans of equity dilution, but consider this a smart decision in the context of where W.P. Carey sits today. National Retail Properties (NNN) and Realty Income have done the same thing successfully for many, many years.
Stocks like WPC are a good buy at 18x and strong buy below 16x. As it stands today, the stock trades at 19x. We are not far off. We reserve target entry and exit points for subscribers, but this should give you a good indication where we stand. For comparison, Realty Income is trading at 24x next year’s earnings and yields 3.6% vs. W.P. Carey’s 5.0% as of the date of this was edited for publication to the public (1/29/2020).
Source: WPC Q3 Report
We can’t expect much better than that without a correction given where interest rates and the overall economy are. The FFO multiple and ~5.0% yield are much more favorable than other REITs with similar balance sheets and dividend history. It’s reasonable to assume modest 2%-3% dividend growth in 2020 and 2021. After that it will depend on how the financials mature from the closure of the private capital business and if CPA 18 is purchased in a similar fashion as CPA 17. Although the higher FFO payout ratio is a concern, WPC remains one of the most robust publicly-traded REITs.
As always, thank you for reading and commenting. -WER Portfolio Managers
Thank you for reading.
Interested in more income recommendations across traditional and nontraditional asset classes including real-time alerts?  Start a free trial of our Institutional Income Plus service. Learn about our institutional investing approach built through experience not just books. Join the community to access this week’s recommendations, and specific entry and exit targets in real-time, involving BDCs, REITs, Preferred Equity, and many others. We have an all-inclusive income model portfolio, allocation guidelines, and issue bi-weekly market commentary.
Disclosure: I am/we are long WPC, O, SKT. I wrote this article myself, and it expresses my own opinions. I am not receiving compensation for it (other than from Seeking Alpha). I have no business relationship with any company whose stock is mentioned in this article.
