Summary
Background
Acute infections can cause an individual to have an elevated resting heart rate (RHR) and change their routine daily activities due to the physiological response to the inflammatory insult. Consequently, we aimed to evaluate if population trends of seasonal respiratory infections, such as influenza, could be identified through wearable sensors that collect RHR and sleep data.
Methods
We obtained de-identified sensor data from 200 000 individuals who used a Fitbit wearable device from March 1, 2016, to March 1, 2018, in the USA. We included users who wore a Fitbit for at least 60 days and used the same wearable throughout the entire period, and focused on the top five states with the most Fitbit users in the dataset: California, Texas, New York, Illinois, and Pennsylvania. Inclusion criteria included having a self-reported birth year between 1930 and 2004, height greater than 1 m, and weight greater than 20 kg. We excluded daily measurements with missing RHR, missing wear time, and wear time less than 1000 min per day. We compared sensor data with weekly estimates of influenza-like illness (ILI) rates at the state level, as reported by the US Centers for Disease Control and Prevention (CDC), by identifying weeks in which Fitbit users displayed elevated RHRs and increased sleep levels. For each state, we modelled ILI case counts with a negative binomial model that included 3-week lagged CDC ILI rate data (null model) and the proportion of weekly Fitbit users with elevated RHR and increased sleep duration above a specified threshold (full model). We also evaluated weekly change in ILI rate by linear regression using change in proportion of elevated Fitbit data. Pearson correlation was used to compare predicted versus CDC reported ILI rates.
Findings
We identified 47 249 users in the top five states who wore a Fitbit consistently during the study period, including more than 13·3 million total RHR and sleep measures. We found the Fitbit data significantly improved ILI predictions in all five states, with an average increase in Pearson correlation of 0·12 (SD 0·07) over baseline models, corresponding to an improvement of 6·3–32·9%. Correlations of the final models with the CDC ILI rates ranged from 0·84 to 0·97. Week-to-week changes in the proportion of Fitbit users with abnormal data were associated with week-to-week changes in ILI rates in most cases.
Interpretation
Activity and physiological trackers are increasingly used in the USA and globally to monitor individual health. By accessing these data, it could be possible to improve real-time and geographically refined influenza surveillance. This information could be vital to enact timely outbreak response measures to prevent further transmission of influenza cases during outbreaks.
Funding
Partly supported by the US National Institutes of Health National Center for Advancing Translational Sciences.
Introduction
Traditional influenza surveillance relies largely on a combination of virologic and syndromic influenza-like illness (ILI) surveillance to estimate influenza trends.
However, ILI surveillance has a 1–3 week reporting lag and is often revised weeks later by the US Centers for Disease Control and Prevention (CDC).
data on internet search terms (eg, Google Flu Trends),
and social media outlets such as Twitter
to provide real-time influenza surveillance. However, despite some success, Google Flu Trends was found to miss early waves of the 2009 H1N1 pandemic influenza
and overestimate activity during outbreaks.
,
Although Twitter could improve traditional ILI surveillance, it had variable success on its own.
,
The challenge with using these methods is distinguishing between activity related to an individual’s own illness and those related to media or heightened awareness and interest about influenza during the influenza season. Consequently, there is a great need to enhance traditional ILI surveillance with new objective data streams that can provide real-time information on influenza activity.
Evidence before this study
Influenza results in up to 650 000 deaths worldwide each year. Traditional influenza surveillance reporting in the USA and globally is often delayed by 1–3 weeks, if not more, and revised months later. This delay can allow outbreaks to go unnoticed, quickly spreading to new susceptible populations and geographical regions. We searched PubMed from Jan 1, 1990, to July 20, 2019, using combinations of words or terms that included “influenza” OR “influenza-like illness” AND “predictions” OR “modeling” OR “nowcasting”. Previous studies have attempted to use crowd-sourced data, such as Google Flu Trends and Twitter, to provide real-time influenza surveillance information—a method known as nowcasting. However, these methods typically overestimate rates during epidemic periods and have variable success on their own, especially at the state level.
Added value of this study
To our knowledge, this is the first study to evaluate and show that objective data collected from wearables significantly improved nowcasting of influenza-like illness. This result held in all five states that we examined, with an average increase in Pearson correlation of 0·12 over baseline, resulting in correlations ranging from 0·84 to 0·97 in the final models. These associations remained consistent when correcting for first-order autocorrelation in time-matched or 1-week-lagged models.
Implications of all the available evidence
In the future, wearables could include additional sensors to prospectively track blood pressure, temperature, electrocardiogram, and cough analysis, which could be used to further characterise an individual’s baseline and identify abnormalities. Future prospective studies will help to differentiate deviations from an individual’s normal levels resulting from infectious versus non-infectious causes, and might even be able to identify infections before symptom onset. Capturing physiological and behavioural data from a growing number of wearable device users globally could greatly improve timeliness and precision of public health responses and even inform individual clinical care. It could also fill major gaps in regions where influenza surveillance data are not available.
and this number continues to grow. Wearable sensors that continuously track an individual’s physiological measurements, such as resting heart rate (RHR), activity, and sleep, might be able to identify abnormal fluctuations indicting perturbations in one’s health, such as an acute infection. It is a normal physiological response to have an elevated RHR as a result of infection, especially when it is accompanied by a fever.
Sleep and activity are also likely to differ from the norm when someone does not feel well. The purpose of our study was to evaluate whether wearable sensor data could improve influenza surveillance at the state level—so-called nowcasting. Enhanced ILI surveillance would improve the ability to enact quick outbreak response measures to prevent further spread of new influenza strains.
Methods
Data collection
Through a research collaboration between Scripps Research Translational Institute and Fitbit, we obtained de-identified data from a convenience sample of 200 000 consistent users who wore a Fitbit device from March 1, 2016, until March 1, 2018. These users wore their Fitbit for at least 60 days during this study time and had only one Fitbit tracker for the whole period. Inclusion criteria included having a self-reported birth year between 1930 and 2004, height greater than 1 m, and weight greater than 20 kg. User location (ie, state) was only collected for measurements after Dec 1, 2016, and was inferred for the previous period on the basis of the most frequent state reported. To sufficiently measure changes at a population level, we only evaluated users from the top five states with the most Fitbit users in our dataset: California, Texas, New York, Illinois, and Pennsylvania. De-identified Fitbit data were used for this study, which was determined by the Scripps institutional review board to be exempt from institutional review board review. All Fitbit users, including those whose data are used in this study, are notified that their de-identified data could potentially be used for research in the Fitbit Privacy Policy.
The dataset included daily measurements of RHR, sleep minutes from main sleep (ie, the longest sleep of the day), and wear time. Daily measurements with missing RHR, missing wear time, and wear time less than 1000 min per day were excluded from the study dataset. We also excluded data obtained in the first 2 weeks of March, 2016, because Fitbit implemented a change in their RHR algorithm at that time. Daily activity data were not available.
CDC ILI rates are calculated as the weekly percentage of outpatient office visits for ILI, which is defined as fever (temperature >37·8°C) and a cough or sore throat without a known cause other than influenza, and are collected from sentinel surveillance clinics.
Calculation of the RHR
The manufacturer has also verified the accuracy of the device in measuring heart rate during still periods by direct comparison with an electrocardiogram (ECG) reference and found a mean average error of less than 1 beat per min (bpm).
Fitbit devices have shown good agreement with polysomnography and ECGs in measuring sleep and heart rate during sleep, with average heart rate less than 1 bpm lower than that recorded by ECG.
,
Data analysis
For each user, overall mean (SD) of RHR and sleep duration during the entire study period were calculated. Any users with fewer than 100 RHR measures were excluded. Each user’s weekly RHR and sleep averages were also calculated to align with CDC ILI surveillance data reported on a weekly basis. Users with fewer than four RHR measures during a given week were omitted from downstream analyses pertaining to that week.
We hypothesised that elevated RHR and increased sleep duration compared with an individual’s average might be indicative of ILI. During each week, a user’s data were identified as abnormal if their weekly average exceeded a given threshold: a sleep time that was longer than 0·5 SD below their overall average and an RHR that was either 0·5 SD (model 1) or 1·0 SD (model 2) above their overall average. Additionally, thresholds that included a constant value higher than average were also evaluated. Users were stratified by state, and the proportion of users meeting these thresholds each week was calculated. Thus, for a given state k, the proportion of users with abnormal data for week j is defined as xj,k,l where l represents the 0·5 SD (model 1) or 1·0 SD (model 2) thresholds above average.
The number of CDC-reported ILI cases yj,k among the number of outpatient office visits nj,k during each week over the observation period across each state k was likewise collected. To simplify analytic issues dealing with 0 case counts in a given week, 1 was added to both measures. The proportion of cases in each state (ie, yj,k/nj,k) is defined as pj,k.
to evaluate the predictive power of Google Flu Trends using CDC ILI rates from up to 3 weeks before, and models the absolute ILI count yj,k in each week j. Formally:
where mabs is a negative binomial model with offset term log(nj,k). The H1 model shown assumes the ILI case count yj,k is affected by the proportion of users with abnormal data, whereas the baseline model mabs,H0 omits xj,k,l such that the null hypothesis is H0: βx= 0 for each state k. Decisions to stratify by state were based on modifications of the mabs model; the modified model combined data across states and included a state main effect and state-by-xj,k,l interaction term:
where 1(k) represents an indicator variable for state k, βk is the coefficient for the main effect, and βx*k is the coefficient for the interaction term. The presence of significant interactions indicated that the effect of the Fitbit variable might differ by state, and thus we opted for a stratified approach.
Finally, we created a linear regression model to predict change in ILI rate from week to week. For each state k, change in ILI rate is given by pj,k* = pj,k – pj − 1,k and change in the proportion of users with abnormal data is given by xj,k,l*= xj,k,l – xj – 1,k,l, and the resulting mchange model more appropriately accounts for autocorrelation that remains present in mabs:
This change is evaluated by linear regression for each state k with elevated sleep and RHR thresholds l. In the first instance, parameters corresponding to the change in proportion xj,k,l of elevated RHR and sleep were of main interest, and compared with models omitting this term. Cross-correlation was used to evaluate 1-week lead (xj − 1,k,l) and 1-week lag (xj + 1,k,l) of the Fitbit data—ie, whether changes in Fitbit data occurred before or after corresponding changes in ILI rates. Pearson correlation (r) was used to compare predicted rates with CDC-reported ILI rates for time-matched, 1-week-lag, and 1-week-lead time periods. Additionally, we assessed correlation using only influenza-season data (week 40 up to week 20 the following year).
Model validation
Role of the funding source
The funder did not play any role in data collection, analysis, interpretation, writing of the manuscript, or decision to submit. JMR had access to all the data and was responsible for the decision to submit the manuscript. The US National Institutes of Health National Center for Advancing Translational Sciences grant UL1TR002550 supported part of the salary for SRS and EJT. Fitbit pulled the data with input from Scripps Research Translational Institute.
Results

Table 1Frequency of self-reported participant characteristics by state from March 15, 2016, to March 1, 2018 (n=47 249)
Data are n (%) or mean (SD). BMI=body-mass index.

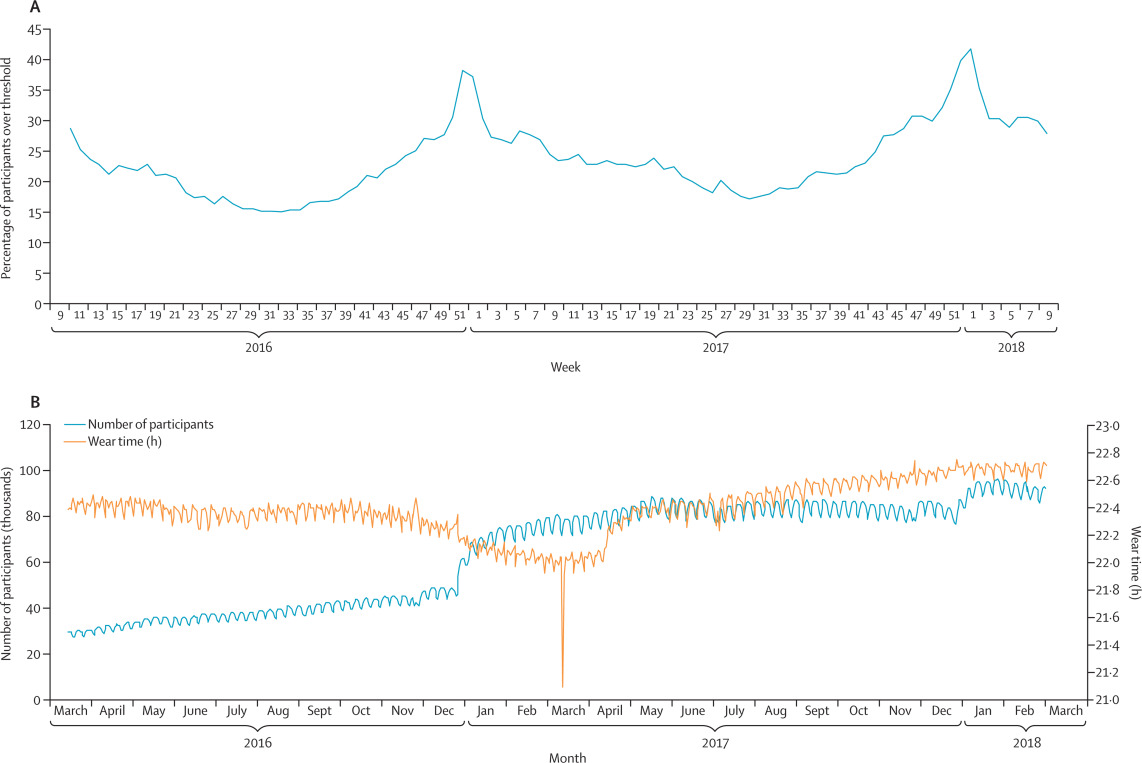
Figure 2Percentage of participants with weekly data above threshold of the mnaive model (A) and average daily wear time against number of users (B)
Data are from March 15, 2016, to March 1, 2018. (A) Measurements from 144 360 users from all states were included. Measurements with missing wear time, wear time less than 1000 min/day or missing RHR were excluded, as well as weeks with fewer than four RHR measurements and users with less than 100 total RHR measurements. Model 1 thresholds were used: participants were over the threshold for any given week if they had a sleep time that was greater than 0·5 SD below their overall average and an RHR that was 0·5 SD above their overall average. (B) Measurements from 186 656 users from all states were included. Measurements with missing wear time, wear time less than 1000 min/day, and missing RHR were excluded for this analysis. The sharp downwards spike in wear time in March, 2017, is the result of daylight saving time. RHR=resting heart rate.
Table 2Number of measurements and average resting heart rate, sleep time, and wear time for full dataset and top five states
Data are n or mean (SD). State data show population averages of individuals’ mean resting heart rate, sleep time, and wear time during entire study period, using data from the final dataset. bpm=beats per min.
Table 3Pearson correlations comparing CDC ILI rates with predicted rates in naive, null, and full negative binomial models and comparing change in CDC ILI rates with change in Fitbit data with a 1-week lag and a 1-week lead
Individuals were classified as having a week with abnormal Fitbit data if their weekly average exceeded a given threshold: a sleep time that was longer than 0·5 SD below their overall average and an RHR that was either 0·5 SD (model 1) or 1·0 SD (model 2) above their overall average. Naive models included just Fitbit data. H0 models assumed the ILI case count was not affected by the proportion of users with abnormal Fitbit data, whereas H1 models assumed that it was. CDC=US Centers for Disease Control and Prevention. ILI=influenza-like illness. RHR=resting heart rate.

Figure 3Weekly CDC ILI rates, predicted ILI rates from the baseline mabs,H0 model, and predicted rates and 95% CIs for the mabs,H1 model, by state
Model 1 is used, with the lower heart rate cutoff. Data are from March 16, 2016, to March 1, 2018. CDC=Centers for Disease Control and Prevention. ILI=influenza-like illness.
Table 4Pearson correlations from model 1 restricted to influenza season only comparing CDC ILI rates with predicted rates in naive, null, and full negative binomial models and comparing change in CDC ILI rates with change in Fitbit data with a 1-week lag and a 1-week lead
Influenza season is defined as week 40 to week 20 in the following year. Individuals were classified as having a week with abnormal Fitbit data if their weekly average exceeded a given threshold: a sleep time that was longer than 0·5 SD below their overall average and an RHR that was 0·5 SD (model 1) above their overall average. Naive models included just Fitbit data. H0 models assumed the ILI case count was not affected by the proportion of users with abnormal Fitbit data, whereas H1 models assumed that it was. CDC=US Centers for Disease Control and Prevention. ILI=influenza-like illness. RHR=resting heart rate.
Discussion
When someone is unwell, their RHR increases, their total sleep is likely to increase, and their activity is likely to decline. However, an elevated amount of sleep or elevated RHR for one person might be a normal level for someone else. Consequently, tracking an individual’s physiological changes over time and comparing their values over time to their individual norm or average could be a means of identifying assaults to their health. Our findings also supported the benefit of using individual health metrics: in our models, we found higher correlations from our predicted values with CDC ILI rates when we used an individual’s SD above normal to identify abnormal values instead of using the same value above average across the entire population.
A study that examined 27 young men with acute febrile infections found that heart rates increased by 8·5 bpm per every 1°C increase in temperature.
Similarly, a study among children with acute infections found that heart rate rose by 9·9–14·1 bpm for every 1°C increase in temperature, with higher increases in younger children.
These studies indicate that infections can increase heart rate, probably due to increased body temperature and inflammatory responses as the body fights off an infection.
Since influenza has an incubation period of 1–4 days, there is only a short opportunity to identify infections before symptom onset. However, since individuals with febrile respiratory illness typically seek care 3–8 days after symptom onset,
it is conceivable that ILI cases could be identified via sensor data earlier than through traditional, clinic-based ILI surveillance. Early identification via our method might be more likely if rates were predicted at a daily, rather than weekly, rate.
,
We found that our correlations improved slightly when we classified people as displaying normal values when they had low sleep. In the future, improved measurements of stress by wearable devices, either by detection of voice changes or galvanic skin response, could further improve our ability to identify other non-infectious causes of elevated RHR.
ILInet (CDC’s influenza database), Twitter, Google Flu Trends, Wikipedia, weather, crowd-sourced data, and school vacation schedule data.
However, Twitter, Google Flu Trends, Wikipedia, and self-reported crowd-sourced data—and even ILInet—are all affected by outside factors such as media coverage of the influenza, with more of the so-called worried well seeking care or searching for information about influenza during epidemic periods. Use of sensor-based data would offer the first objective and real-time measurement of illness in a population that could potentially reduce the effect of overestimation during epidemics
By incorporating Fitbit data, we were able to improve ILI predictions at the state level. The predicted values from our mnaive model that just used the Fitbit variable with no lag indicate that this sensor-based method could potentially be useful on its own in local regions where ILI surveillance data might not be available. With greater volumes of data to analyse, this sensor-based surveillance method could be applied to more geographically refined areas in the future, such as county-level or city-level data.
Individuals with comorbidities, as well as young children and people older than 65 years, typically have more severe responses to influenza infections
,
and could have higher heart rate responses. In the future, understanding the role of individual characteristics such as age, comorbidities, obesity, and sex on abnormal values will be important for improving ILI prediction using this method.
,
than other strains. Like the CDC, which identified higher rates of ILI for 2017–18, we also saw higher peaks of the proportion of users with elevated Fitbit data during this influenza season compared with the previous year. It is also possible that our algorithm could pick up less severe infections that would not necessarily be captured by traditional ILI surveillance, which requires a visit to a health-care provider. Future work to better understand typical heart rate responses to specific viral or bacterial infections or even different influenza subtypes could improve our ability to track infections.
social mixing, increases in health-care seeking, differences in surveillance reporting,
and potentially changes in alcohol consumption and stress. These factors could increase susceptibility to infection and can also affect ILI surveillance. A study found that RHR is higher at very cold or hot temperatures
and heart rate can also be elevated when someone is dehydrated, which could be more likely to happen during certain seasons. Additionally, people might be less active during colder, winter months, resulting in deconditioning and increased heart rate. Future prospective studies should attempt to measure and adjust for these external variables and link individual Fitbit data to reported symptoms or laboratory influenza confirmation.
However, accuracy of devices will continue to improve as technology evolves.
Quick detection of increases in ILI, indicating potential influenza epidemics, is key to early initiation of important non-pharmaceutical (eg, staying home when sick or handwashing) and pharmaceutical interventions (deploying antivirals and vaccines) that can help to prevent further spread and infection in the most susceptible populations. This study shows that using RHR and other metrics from wearables has the potential to improve real-time ILI surveillance. New wearables that include continuous sensors for temperature, blood pressure, pulse oximetry, ECG, or even cough recognition
,
are likely to further improve our ability to identify population and even individual-level influenza activity. In the future, with access to real-time data from these devices, it might be possible to identify ILI rates on a daily, instead of weekly, basis, providing even more timely surveillance. As these devices become more ubiquitous, this sensor-based surveillance technique could even be applied at a more global level where surveillance sites and laboratories are not always available.
JMR did the literature search, conceived the study design, and did the data analysis, data interpretation, figure creation, and writing of the manuscript. NEW contributed to the study design, data analysis, data interpretation, and writing of the manuscript. EJT and SRS revised the manuscript and provided scientific input. All authors edited and approved the final draft.
We declare no competing interests.
