
I made a lot of money in 2019, and so did my clients. I hope you did too. A 29% gain (or more) isn’t as rare as you might think.
Since 1928 (92 years), there have been 20 instances where the market performed as well, or better, than it did in 2019. That works out to a 2019-sized gain about every 5 years.
But this article looks at an inconvenient feature of the great 2019 bull market, which is the trend, or the rate of acceleration if you like.
2019 – Accelerating Prices with a Decelerating Rate of Change
This is the only chart for the article. It shows the daily percentage change in the S&P 500 index for every trading day in 2019. The red line is a linear regression of the average distance above and below the full-year average of daily changes.
It’s not surprising to see a deceleration in the growth trend after such a strong gain in the market. Buyers naturally begin to question the wisdom of buying stocks at ever-higher prices. Sellers become more willing to part with the holdings that have sustained them over the years. And those who sit on the sidelines, waiting for lower entry points, continue to wait.
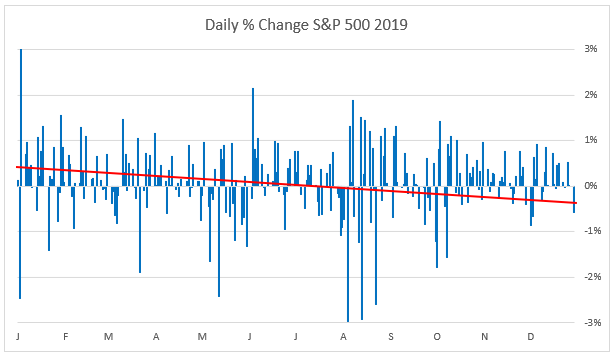
The year 2019 started out with a bang after the nearly 20% drop in Q4 2018. There was enthusiasm among investors, which translated into price acceleration in the early months. But such enthusiasm can’t be sustained forever. At some point, investors begin to wonder if the market may have gotten a little ahead of itself, so they slow their buying just a bit.
That’s what we see on the chart – a slowdown in buying enthusiasm. It doesn’t spell the end of the great bull run of the last decade. It simply means that investors are waiting for the next catalyst that can kick the market into a higher gear once again.
Will they get their wish? Who knows? This chart tells me that the bulls may still be in charge of the market, but they need a reason to go back to the heady days of early 2019.
Disclosure: I am/we are long SPY, VTI.
Editor’s Note: The summary bullets for this article were chosen by Seeking Alpha editors.
