
In this tutorial, You’ll learn Logistic Regression. Here you’ll know what exactly is Logistic Regression and you’ll also see an Example with Python. Logistic Regression is an important topic of Machine Learning and I’ll try to make it as simple as possible.
In the early twentieth century, Logistic regression was mainly used in Biology after this, it was used in some social science applications. If you are curious, You may ask where we should use logistic regression? So we use Logistic Regression when our independent variable is categorical.
Examples:
- To predict whether a person will buy a car (1) or (0)
- To know whether the tumor is malignant (1) or (0)
Now let us consider a scenario where you have to classify whether a person will buy a car or not. In this case, if we use simple linear regression, we will need to specify a threshold on which classification can be done.
Let say the actual class is the person will buy the car, and predicted continuous value is 0.45 and the threshold we have considered is 0.5, then this data point will be considered as the person will not buy the car and this will lead to the wrong prediction.
So we conclude that we can not use linear regression for this type of classification problem. As we know linear regression is bounded, So here comes logistic regression where value strictly ranges from 0 to 1.
Simple Logistic Regression:
Output: 0 or 1
Hypothesis: K = W * X + B
hΘ(x) = sigmoid(K)
Sigmoid Function:


Types of Logistic Regression:
Binary Logistic Regression
Only two possible outcomes(Category).
Example: The person will buy a car or not.
Multinomial Logistic Regression
More than two Categories possible without ordering.
Ordinal Logistic Regression
More than two Categories possible with ordering.
Real-world Example with Python:
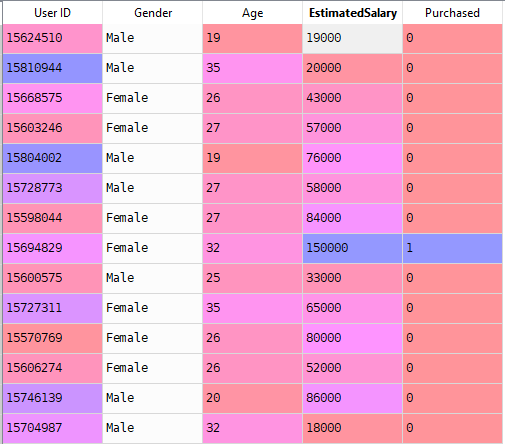
Now we’ll solve a real-world problem with Logistic Regression. We have a Data set having 5 columns namely: User ID, Gender, Age, EstimatedSalary and Purchased. Now we have to build a model that can predict whether on the given parameter a person will buy a car or not.
Steps To Build the Model:
1. Importing the libraries
Here we’ll import libraries which will be needed to build the model.
import numpy as np
import matplotlib.pyplot as plt
import pandas as pd
2. Importing the Data set
We’ll import our Data set in a variable (i.e dataset) using pandas.
dataset = pd.read_csv('Social_Network_Ads.csv')3. Splitting our Data set in Dependent and Independent variables.
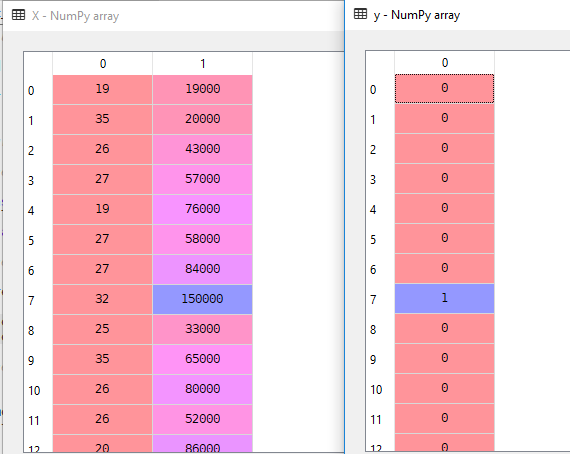
In our Data set we’ll consider Age and EstimatedSalary as Independent variable and Purchased as Dependent Variable.
X = dataset.iloc[:, [2,3]].values
y = dataset.iloc[:, 4].values
Here X is Independent variable and y is Dependent variable.
3. Splitting the Data set into the Training Set and Test Set
Now we’ll split our Data set into Training Data and Test Data. Training data will be used to train our
Logistic model and Test data will be used to validate our model. We’ll use Sklearn to split our data. We’ll import train_test_split from sklearn.model_selection
from sklearn.model_selection import train_test_split
X_train, X_test, y_train, y_test = train_test_split(X, y, test_size = 0.25, random_state = 0)
4. Feature Scaling
Now we’ll do feature scaling to scale our data between 0 and 1 to get better accuracy.
Here Scaling is important because there is a huge difference between Age and EstimatedSalay.
- Import StandardScaler from sklearn.preprocessing
- Then make an instance sc_X of the object StandardScaler
- Then fit and transform X_train and transform X_test
from sklearn.preprocessing import StandardScaler
sc_X = StandardScaler()
X_train = sc_X.fit_transform(X_train)
X_test = sc_X.transform(X_test)
5. Fitting Logistic Regression to the Training Set
Now we’ll build our classifier (Logistic).
- Import LogisticRegression from sklearn.linear_model
- Make an instance classifier of the object LogisticRegression and give
random_state = 0 to get the same result every time. - Now use this classifier to fit X_train and y_train
from sklearn.linear_model import LogisticRegression
classifier = LogisticRegression(random_state=0)
classifier.fit(X_train, y_train)
Cheers!! After executing the above command you’ll have a classifier that can predict whether a person will buy a car or not.
Now use the classifier to make the prediction for the Test Data set and find the accuracy using Confusion matrix.
6. Predicting the Test set results
y_pred = classifier.predict(X_test)Now we’ll get y_pred

Now we can use y_test (Actual Result) and y_pred ( Predicted Result) to get the accuracy of our model.
7. Making the Confusion Matrix
Using Confusion matrix we can get accuracy of our model.
from sklearn.metrics import confusion_matrix
cm = confusion_matrix(y_test, y_pred)
You’ll get a matrix cm .

Use cm to calculate accuracy as shown below:
Accuracy = ( cm[0][0] + cm[1][1] ) / ( Total test data points )

Here we are getting accuracy of 89 % . Cheers!! we are getting a good accuracy.
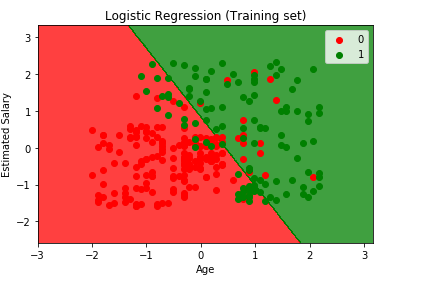
Finally, we’ll Visualise our Training set result and Test set result. We’ll use matplotlib to plot our Data set.
Visualizing the Training Set result
from matplotlib.colors import ListedColormap
X_set, y_set = X_train, y_train
X1, X2 = np.meshgrid(np.arange(start = X_set[:, 0].min() - 1, stop = X_set[:, 0].max() + 1,   step = 0.01),
                     np.arange(start = X_set[:, 1].min() - 1, stop = X_set[:, 1].max() + 1, step = 0.01))
plt.contourf(X1, X2, classifier.predict(np.array([X1.ravel(), X2.ravel()]).T).reshape(X1.shape),
             alpha = 0.75, cmap = ListedColormap(('red', 'green')))
plt.xlim(X1.min(), X1.max())
plt.ylim(X2.min(), X2.max())
for i, j in enumerate(np.unique(y_set)):
    plt.scatter(X_set[y_set == j, 0], X_set[y_set == j, 1],
                c = ListedColormap(('red', 'green'))(i), label = j)
plt.title('Logistic Regression (Training set)')
plt.xlabel('Age')
plt.ylabel('Estimated Salary')
plt.legend()
plt.show()
Visualizing the Test Set result
from matplotlib.colors import ListedColormap
X_set, y_set = X_test, y_test
X1, X2 = np.meshgrid(np.arange(start = X_set[:, 0].min() - 1, stop = X_set[:, 0].max() + 1, step = 0.01),
                     np.arange(start = X_set[:, 1].min() - 1, stop = X_set[:, 1].max() + 1, step = 0.01))
plt.contourf(X1, X2, classifier.predict(np.array([X1.ravel(), X2.ravel()]).T).reshape(X1.shape),
             alpha = 0.75, cmap = ListedColormap(('red', 'green')))
plt.xlim(X1.min(), X1.max())
plt.ylim(X2.min(), X2.max())
for i, j in enumerate(np.unique(y_set)):
    plt.scatter(X_set[y_set == j, 0], X_set[y_set == j, 1],
                c = ListedColormap(('red', 'green'))(i), label = j)
plt.title('Logistic Regression (Test set)')
plt.xlabel('Age')
plt.ylabel('Estimated Salary')
plt.legend()
plt.show()

Now You can build your own classifier for Logistic Regression.
Thanks!! Keep Coding !!
Note: This is a guest post, and opinion in this article is of the guest writer. If you have any issues with any of the articles posted at www.marktechpost.com please contact at [email protected]m
