
2 hours ago | Matthew North

| ⠀Bitcoin price: | $8,458.14 |
|---|---|
| ⠀Key BTC resistance levels: | $8,690.57, $8,923.00 |
| ⠀Key BTC support levels: | $8,308.88, $8,159.62 |
*Price at the time of writing
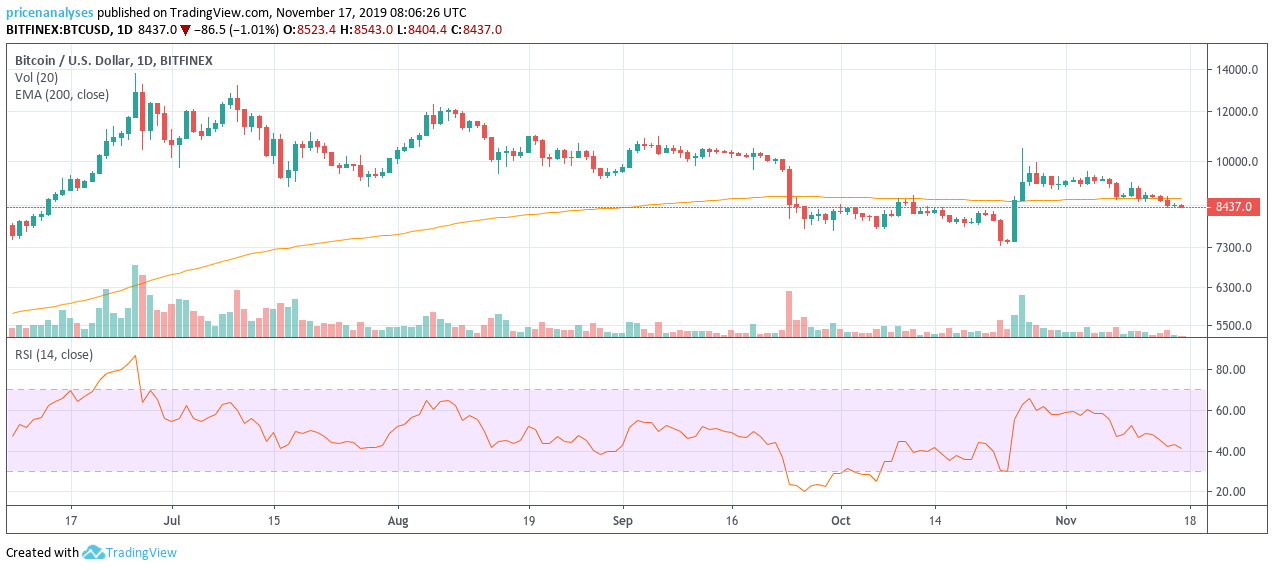
Bitcoin is struggling to maintain above the 200-day EMA dynamic inflection point and dipped below it on November 14. The break of the EMA means that bitcoin is officially in a downward trend over the long-term, and by all accounts, it seems that this negative trend will continue into next week.
Bitcoin’s high of $8,531.36 broke through some key milestones for the cryptocurrency, including a 50% retracement from its 52 weeks high/low at $8,501.20 and a 38.2% retracement from its four week low at $8,475.79. These key retracements show that the price briefly rebounded from these lows and highs over the short-term but failed to take hold.
Overall, it seems that bitcoin is slowly slipping away from the highs it reached on October 27 and we’re now falling downwards – albeit in a sideways motion.
Bitcoin Short Term Analysis: Bearish
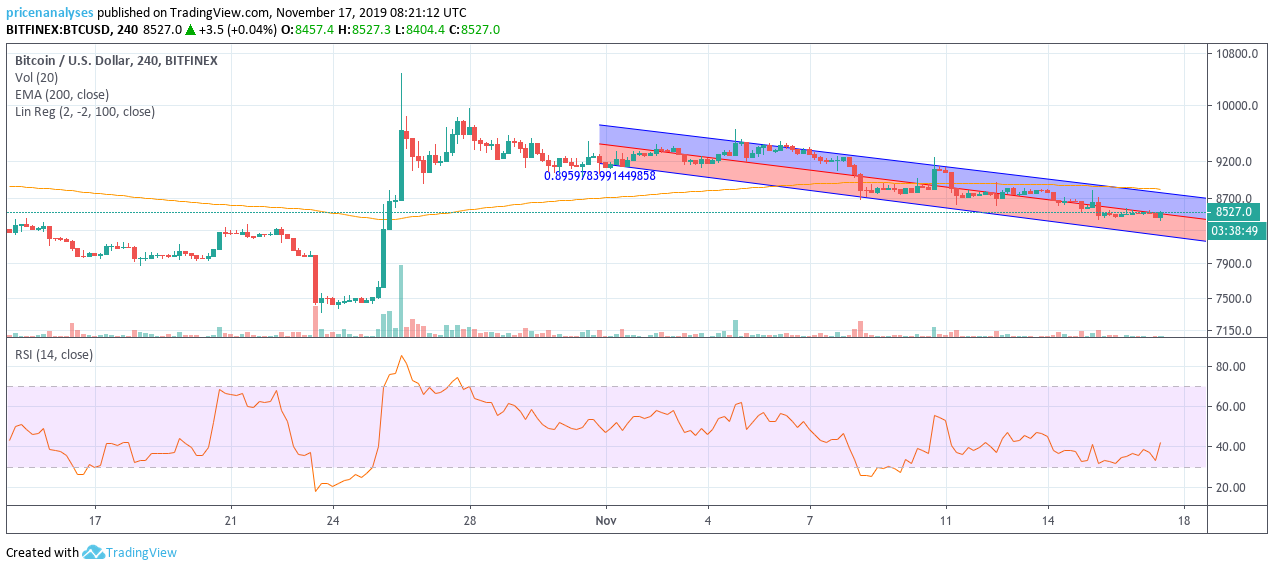
So we know that bitcoin is trading sideways over the long-term and that it’s below its key moving average, how does it look in short-term? The answer can be found in the linear regression line which gives a line of best fit.
The downward trend on the 4-hourly chart is obvious when overlaid with this indicator. Additionally, RSI, as well as volumes, are in lower levels than where they were in previous days, with the RSI moving a tick higher.
It’s therefore unlikely that bitcoin will make any significant moves to the upside at any point soon.
Bitcoin Alternative Analysis
There is a contrarian point of view on bitcoin that states that bitcoin is showing some bullish signs as it’s above the downward sloping resistance line and has created a falling wedge pattern as can be seen in the graph below.

For more Bitcoin price analysis follow subscribe to CoinCodex TV.
