
ADA Price Analysis – February 16
ADA/USD takes a deep dig and slides to $0.056 but the coin is expected to recover in a few days’ time.
ADA/USD Market
Key Levels:
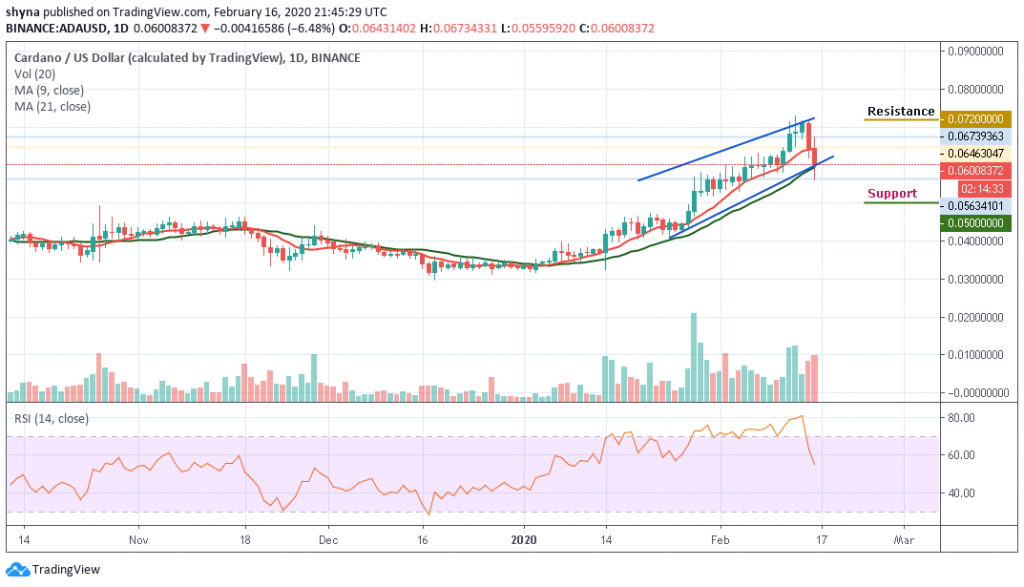
Supply levels: $0.072, $0.074, $0.076
Demand levels: $0.050, $0.048, $0.046

Cardano (ADA) has been maintaining an uptrend since last week. The traders were deeply impressed by the coin. ADA inclined in the rank chart of the crypto market and be among the top-eleven. Everything was going well until yesterday’s drop when the market drenched in blood. It may take some time for ADA/USD to come out of the bearish zone as the technical indicator RSI (14) moves below the 55-level.
At the moment, the market is trading below the 9-day and 21-day moving averages. If we can see an increasing volume coupled with a bullish regroup, the ADA/USD pair may start to correct gain significantly on the upside. Otherwise, the bear pressure will become severe with more losses.
However, the Cardano price is expected to retest resistance at $0.067 before the rally continues. Watching out for the next key resistance; the $0.072, $0.074 and $0.076 levels seem closer for the bull sides.
In the opposite direction, the ADA/USD pair may roll back to $0.56 support if the bears step back in the market fully. A break at $0.053 could establish a new low at $0.050, $0.048 and $0.046.
ADA/BTC Market
Pairing with Bitcoin, the direction of the market is synonymous with the market of the Dollar as ADA followed a break-down that was shown in the ascending channel. Although the price is still unstable; trading at a price level of 614 SAT. A low swing could reach the 590 SAT support level below the 9-day and 21-day moving averages.
However, should in case the pair crosses down the support at 550 SAT, additional supports may be created at 530 SAT and below. In other words, on the upside, a rebound may likely occur as the bullish sides could strongly defend the 600 level and push the price to 700 SAT resistance level and above. But for now, the bears are gaining ground while they are declining as the RSI (14) moves below 55-level.
Please note: Cryptovibes.com is not a financial advisor. Do your research before investing your funds in any financial asset or presented product or event. We are not responsible for your investing results.
