

We frequently come out with resources
for aspirants and job seekers in data science to help them make a career in
this vibrant field. Cracking interviews especially where understating of machine
learning is needed can be tricky. Here are 60 most commonly asked interview
questions for data scientists, broken into linear regression, logistic
regression and clustering.
Part 1 – Linear Regression
36 Question
- What is linear regression?
- A linear regression is a linear approximation of a causal relationship between two or more variables.
- It falls under the supervised machine learning algorithms.
- What is process of carrying out a linear regression?
- Get sample data
- Design a model that works on
that sample - Make predictions for the whole
population
- How do you represent a simple linear regression?
- Y = b0 +b1 x1 + e
- Y – dependent variable
- X1 – independent variable
- e – Error term = Y – Y(hat)
- What is the difference between correlation and regression?
- Correlation does not apply
causation. Regression is done to understand the impact of independent variable
on the dependent variable. - Correlation is symmetric
regrading both the variables p(x,y) = p(y,x). Regression is one way. - Correlation does not capture the
direction of causal relationship. Regression captures the cause and
effect.
- What are the columns in the coefficient table?
- The coefficient table contains
the variable name, coefficient, standard error and p-value.
- What is standard error?
- Standard error shows the
accuracy for each variable
- What is p-value?
- The p-value shows the
significance of the variable. It tells us if the variable is useful or
not. - The H0 is coefficient = 0 and
the H1 is coefficient ≠ 0 - If p-value < 0.05 (in most
of the cases) we reject H0
- What is OLS?
- OLS stands for ordinary least square
- It measures the error between
the actual Y and predicted Y - Lower the error, better is the
model
- What are the other regression methods?
- Generalized least squares
- Maximum likelihood estimates
- Bayesian regression
- Kernel regression
- Gaussian regression
- What is TSS, ESS and RSS?
- TSS stands for Total Sum of Squares. It measures the total variability.
- TSS = ∑(y – y(mean))2
- ESS stands for Explained Sum of Squares. It measures the variability that is explained.
- ESS = ∑(y(pred) – y(mean))2
- RSS stands for Residual Sum of Squares. It measures the difference between the observed Y and predicted Y.
- RSS = ∑(y – y(pred))2
- What is the relationship between TSS, ESS and RSS?
- TSS = ESS + RSS
- Total variability = Explained variability + Unexplained variability
- What is R-Squared?
- R-Squared is also known as goodness of fit
- Smaller the RSS, better is the model
- R-Sq = ESS / TSS = 1 – (RSS / TSS)
- R-Squared takes a value between 0 and 1.
- If R-Sq = 0 then the model does not explain any variability
- If R-Sq = 1 then the model explains entire variability
- What is adjusted R-Squared?
- Adjusted R-Squared is a step on R-Squared and adjusts for the number of variables included in the model
- As we add more variables the explanatory power of the model may increase.
- Adjusted R-Squared penalizes the model for the number of variables that are used in the model.
- What is the relationship between R-Squared and Adjusted R-Squared?
- Adj R-Sq is always lower than the R-Sq
- Adj R-Sq = 1 – ((1-RSq) * (n-1) / (n-p-1))
- Where n is the number of observations and p is the number of variables
- What happens when we add a variable and it increases the R-Sq but decreases the Adj R-Sq?
- The variable can be omitted since it holds no predictive power
- We should also look at the p-value of the added variable and confirm our decision
- What is feature selection?
- It is a method to simplify the model and improves the speed
- It is done to avoid too many features
- p-value in regression coefficient table can be used to drop insignificant variables
- What is feature scaling?
- Different variables have different magnitude
- Feature scaling is done to bring the variables to the same magnitude
- Standardization is one of the methods used for feature scaling
- What is standardization?
- It is also called normalization
- X (std) = (x – µ) / σ
- Regardless of the data we will get data with mean 0 and standard deviation of 1
- What is the interpretation of the weights?
- In ML coefficients are called weights.
- A positive weight shows that as feature increases in value, so does Y
- A negative weight shows that as feature decreases in value, so does Y
- What is the difference between overfitting and underfitting?
- Underfitting happens when the
model has not captured the underlying logic of the data. - Overfitting happens when the
model has focused too much on the training dataset that it cannot understand
test dataset
- How to identify if the model is overfitting or underfitting?
- Underfit model performs bad
(low accuracy) on training and bad (low accuracy) on test. - Overfit model performs good
(high accuracy) on training and bad (low accuracy) on test. - A good model performs good
(high accuracy) on training and good (high accuracy) on test.
- What is multiple linear regression?
- In multiple linear regression
that are more than one predictor. - Good models require multiple
independent variables in order to address the higher complexity of the problem. - Y = b0 +b1 x1 + b2 x2 + … + bk
xk + e
- What are the assumptions of linear regression?
- Linearity
- No endogeneity
- Normality and homoscedasticity
- No autocorrelation
- No multi-collinearity
- What happens if the linear regression violates any of its
assumptions? - The biggest mistake you can
make is to perform a regression that violates one of its assumptions. - If the regression assumptions
are violated, then performing regression analysis will yield incorrect results.
- What does linearity mean?
- It means a linear relationship
- To check if there is linear
relationship between x and y the simplest thing to do is plot a scatter plot
between x and y
- What are the fixes of linearity?
- If linearity assumption is
violated, then we can use non-linear regression - We can also transform the x
(exponential transformation / log transformation)
- What does no endogeneity mean?
- No endogeneity means no
relationship between x and ε - It may be because we have
omitted an important predictor from the model
- What is omitted variable bias?
- If the modeler forgets to
include an important predictor in the model - It may lead to counter-intuitive
coefficient signs - Once the important variable is
included rest of the coefficients fall into place
- What is the assumption of normality?
- It means the normal
distribution of the error term - The mean of the residuals
should be zero - The standard deviation of the
residuals should be constant
- What is the assumption of homoscedasticity?
- In simple terms it means the
equal variance - There is no relationship
between the error term and the predicted Y
- How to prevent heteroscedasticity?
- It may be due to outliers
- It may be due to omitted
variable bias - Log transformation
- What does autocorrelation mean?
- It is common in time series
modeling - It means that Y(t) is dependent
on historical values, Y(t-1) or Y(t-2) or … Y(t-k)
- How to detect autocorrelation?
- DW test is used to detect
autocorrelation - If DW test statistics is less
than 1 then there is strong autocorrelation - If DW test statistics is close
to 2 then there is no autocorrelation - If DW test statistics is more
then 3 then there is strong autocorrelation
- What are the remedies to remove autocorrelation?
- There is no remedy in linear
regression - The modelers can try different
models like AR, MA, ARMA or ARIMA
- What does multicollinearity mean?
- When two or more variables have
high correlation - If there is perfect
multicollinearity then standard error will be infinite - Imperfect multicollinearity
means that the correlation is slightly less than 1 or slightly more than -1.
However imperfect multicollinearity also causes serious issues in the model
- What are the fixes of multicollinearity?
- Find the correlation between
each pair of independent variables - If two variables are highly
correlated, then either drop one of them or transform them into a single
variable
Part 2 – Logistic Regression
10 Question
- What is logistic
regression? - Logistic regression predicts the probability of an event occurring
- LN (π / (1-π)) = b0 +b1 x1 + b2 x2 + … + bk xk + e
- LN (π / (1-π)) is called
log-odds
- Why cannot we use linear
regression for dichotomous output? - The linear regression is used
for unbounded output - The linear regression does not
know that the output is bounded between 0 and 1
- What are the assumptions of logistic regression?
- Linearity
- No endogeneity
- Normality and homoscedasticity
- No autocorrelation
- No multi-collinearity
- What is MLE?
- MLE stands for maximum
likelihood estimate - It is a function which
estimates how likely it is that the model at hand describes the real underlying
relationship of the variables. - Bigger the MLE, the higher the
probability that our model is correct.
- How to interpret the coefficients of the logistic regression?
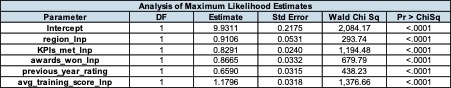
- The predicted variable is “is_promoted”
- The coeffects can be
interpreted as
LN(is_promoted
/ (1- is_promoted)) = 9.9311 + 0.9106 x region_lnp + 0.8291 x KPIs_met_lnp +
0.8665 x awards_won_lnp + 0.659 x previous_year_rating + 1.1796 x avg_training_score_lnp
- What is the sensitivity of the variable “avg_training_score_lnp”
based on the coefficient table? - LN(is_promoted 2 / is_promoted
1) = 1.1796 x (avg_training_score_lnp 2 – avg_training_score_lnp 1) - If the avg_training_score_lnp
is increased by 1 unit then is_promoted 2 = 3.2531 * is_promoted 1 - That means the is_promoted
increases by 3.25 times.

- c is equivalent to the
well-known measure ROC. - c ranges from 0.5 to 1, where
0.5 corresponds to the model randomly predicting the response, and a 1
corresponds to the model perfectly discriminating the response.
- What is concordance / discordance / tie pairs?
- Percent Concordant – A pair of observations with different observed responses is said to
be concordant if the observation with the lower ordered response value (0) has
a lower predicted mean score than the observation with the higher ordered
response value (1). - Percent Discordant – If the observation with the lower ordered response value has a
higher predicted mean score than the observation with the higher ordered
response value, then the pair is discordant. - Percent Tied – If a pair of observations with different responses is neither
concordant nor discordant, it is a tie.
- How to measure the accuracy of logistic regression?
- Where the prediction is <
0.5 there the predicted variable = 0. Where the prediction is >= 0.5 there
the predicted variable = 1. - Confusion matrix is used to
measure the accuracy of the logistic regression.
- What is the accuracy and misclassification for the below confusion
matrix?

- Accuracy is defined as correct
classification by the algorithm - Based on the above confusion
matrix, accuracy = (49845 + 4008) / 54808 - Misclassification is 1 –
accuracy, misclassification = 1- 98.3%
Part 3 – Clustering
14 Question
- What is cluster analysis?
- Cluster analysis is a multivariate statistical technique that groups
observations based on their features - Observations in a dataset can be divided into different groups and
sometimes this is very useful
- What is the goal of
clustering analysis? - The goal of clustering analysis is to maximize the similarity of
observations within a cluster and maximize the dissimilarity between clusters
- What is the difference
between supervised learning and unsupervised learning? - In supervised learning we are dealing with labelled data. We know the
correct values before training our model. Examples are regression and
classification. - In unsupervised learning we do not know the correct values before
training our model. Examples are clustering.
- What is Euclidean
distance? - Euclidean distance measure the shortest distance between two points
(x1,y1) and (x2,y2) - ED = SQRT((x2-x1)^2 + (y2-y1)^2)
- What is centroid?
- Centroid is the midpoint between two points (x1,y1) and (x2,y2)
- C = ((x2+x1)/2 , (y2+y1)/2)
- What is the different
between exploratory and confirmatory & explanatory analysis? - Exploratory analysis:
- Confirmatory & explanatory analysis:
- Validate previous research
- What is K-Means algorithm?
- We start with selecting the number of clusters we want
- Next, we specify the cluster seeds – the starting centroids
- Then, we assign each point to a centroid
- We adjust the centroids
- The above two steps are repeated will we can no longer assign the points
- What are the pros and cons
of the K-Means algorithm? - Pros:
- Cons:
- We need to pick number of clusters
- Sensitive to initialization
- How do we select the
number of clusters? - Elbow method is used to determine the number of clusters
- The objective is to minimize the within cluster sum of squares
- Based on the below graph
suggest the number of clusters?

- At number of clusters = 5 we reach an elbow
- Based on the number of clusters = 5 the centroid of the clusters is
summarized below.

- How can we make sure that
K-Means output is not sensitive to initialization? - Run multiple K-means with different initialization and compare results
- Use KMeans++ algorithm to get the most optimal seed
- What is hierarchical
clustering? - Hierarchical clustering is a method of cluster analysis which seeks to
build a hierarchy of clusters. - Hierarchical clustering came before K-Means clustering
- One of the examples is animal kingdom.
- What are the different
methods of hierarchical clustering? - Agglomerative – Also called bottom-up approach. Each observation starts in its own
cluster and pairs of clusters are merged as one moves up the hierarchy. - Divisive – Also called top-down approach. All observations start in one cluster,
and splits are performed recursively as one moves down the hierarchy.
- What are the pros and cons
of the hierarchical clustering? - Pros:
- Shows all possible linkages
- Give much better understanding of data
- No need to pre-define the number of clusters
- Cons:
- Computationally expensive
Enjoyed this story? Join our Telegram group. And be part of an engaging community.

