
Tron (TRX) Price Analysis – February 3
Since the month started, Tron (TRX) is yet to display a significant bullish move as the market continues to move in sideways.
TRX/USD Market
Key Levels:
Resistance levels: $0.0210, $0.0215, 0.0220
Support levels: $0.0170, $0.0165, $0.0160
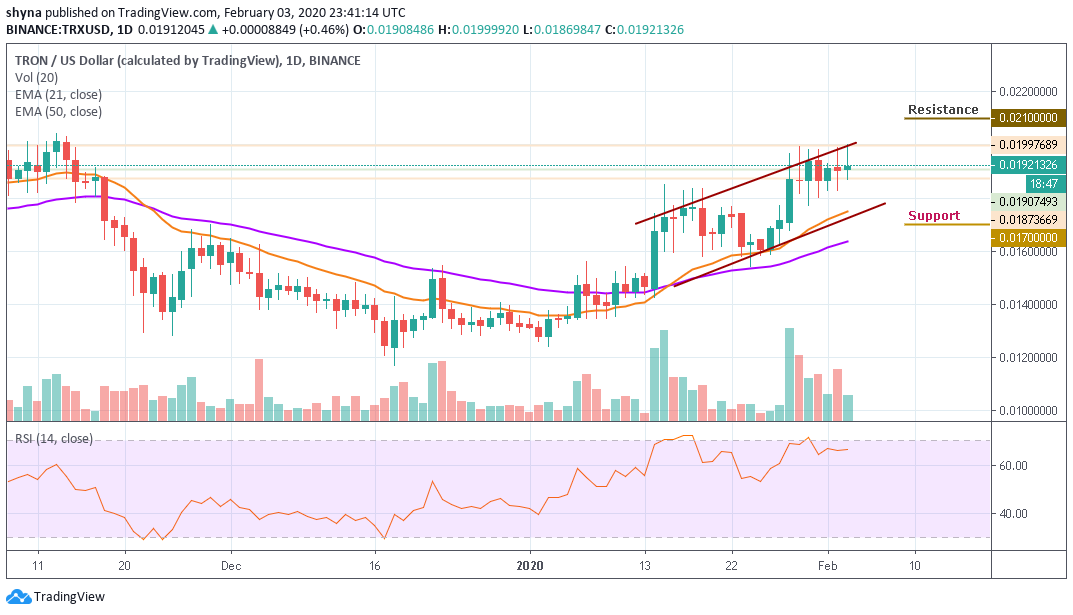
TRX/USD remained indifferent to the news. The last three days were moving up and down, wherein the price rose from $0.0186 to $0.0192. Today, the price has gone up to $0.0199 before reversing to $0.0192. The daily price is still trading above the 21 and 50 periods EMA as the trading volume increases. More so, the Tron (TRX) remains in an unstable market, a price surge may likely play out.
However, for an upsurge, the Tron price is likely to meet the nearest resistances above the channel at $0.0210, $0.0215 and $0.0220 before we can consider more levels for the trade. A down surge, however, could plummet the market to $0.0170, $0.0165 and $0.160 supports after a possible break at $0.0180. The RSI (14) has maintained a sideways movement, though moving around 65-level to show an indecisive movement.
TRX/BTC Market
Against Bitcoin, Tron (TRX) is trading on the upside as the price is moving within the ascending channel and above the 21 and 50 periods of EMA. Similarly, as the trading volume is rising, the buying pressure has already resumed and the Tron price variation continues the uptrend. The TRX/BTC daily chart reveals that the RSI (14) moves above level 60; the price movement may likely enter the overbought zone if the bulls keep on pushing it upward.
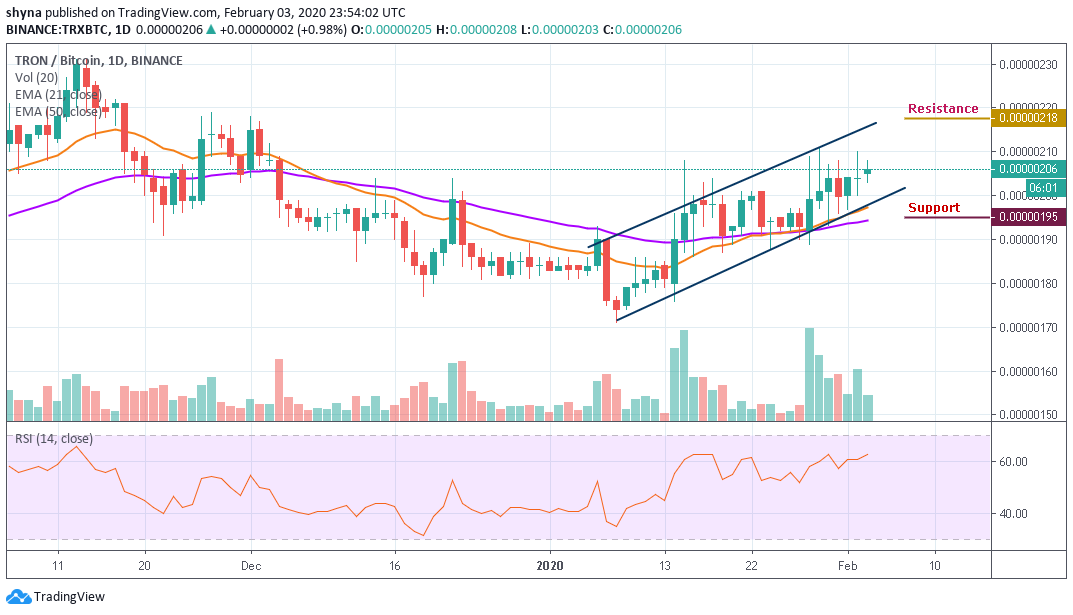
However, TRX/BTC is trading around the 206 SAT. Traders can expect a close resistance at the 215 SAT before breaking to 218 SAT and potentially 220 SAT levels. Nevertheless, if the bearish steps-in and validate a break below the 21 and 50 periods EMA; we can then confirm a downtrend for the market and the closest support levels could be 195 SAT, 193 SAT and 191 SAT respectively.
