
Before the weekend, we saw Bitcoin trading safely and easily on its way to $10,000. However, on our recent analysis two days ago, we had pointed out on some indicators that might put some bearish pressure on the cryptocurrency.
Since then, we saw a correction of almost $300 down to a current daily low of $9130 (Bitstamp rate). On the bigger time-frame, in case this correction doesn’t go lower, it seems very healthy for the short-term since this level is a little above the 38.2% Fibonacci retracement level of the recent bullish move.
As of writing these lines, Bitcoin had recovered nicely, and now the coin is back again inside the $9300 – $9400 confluence price zone.
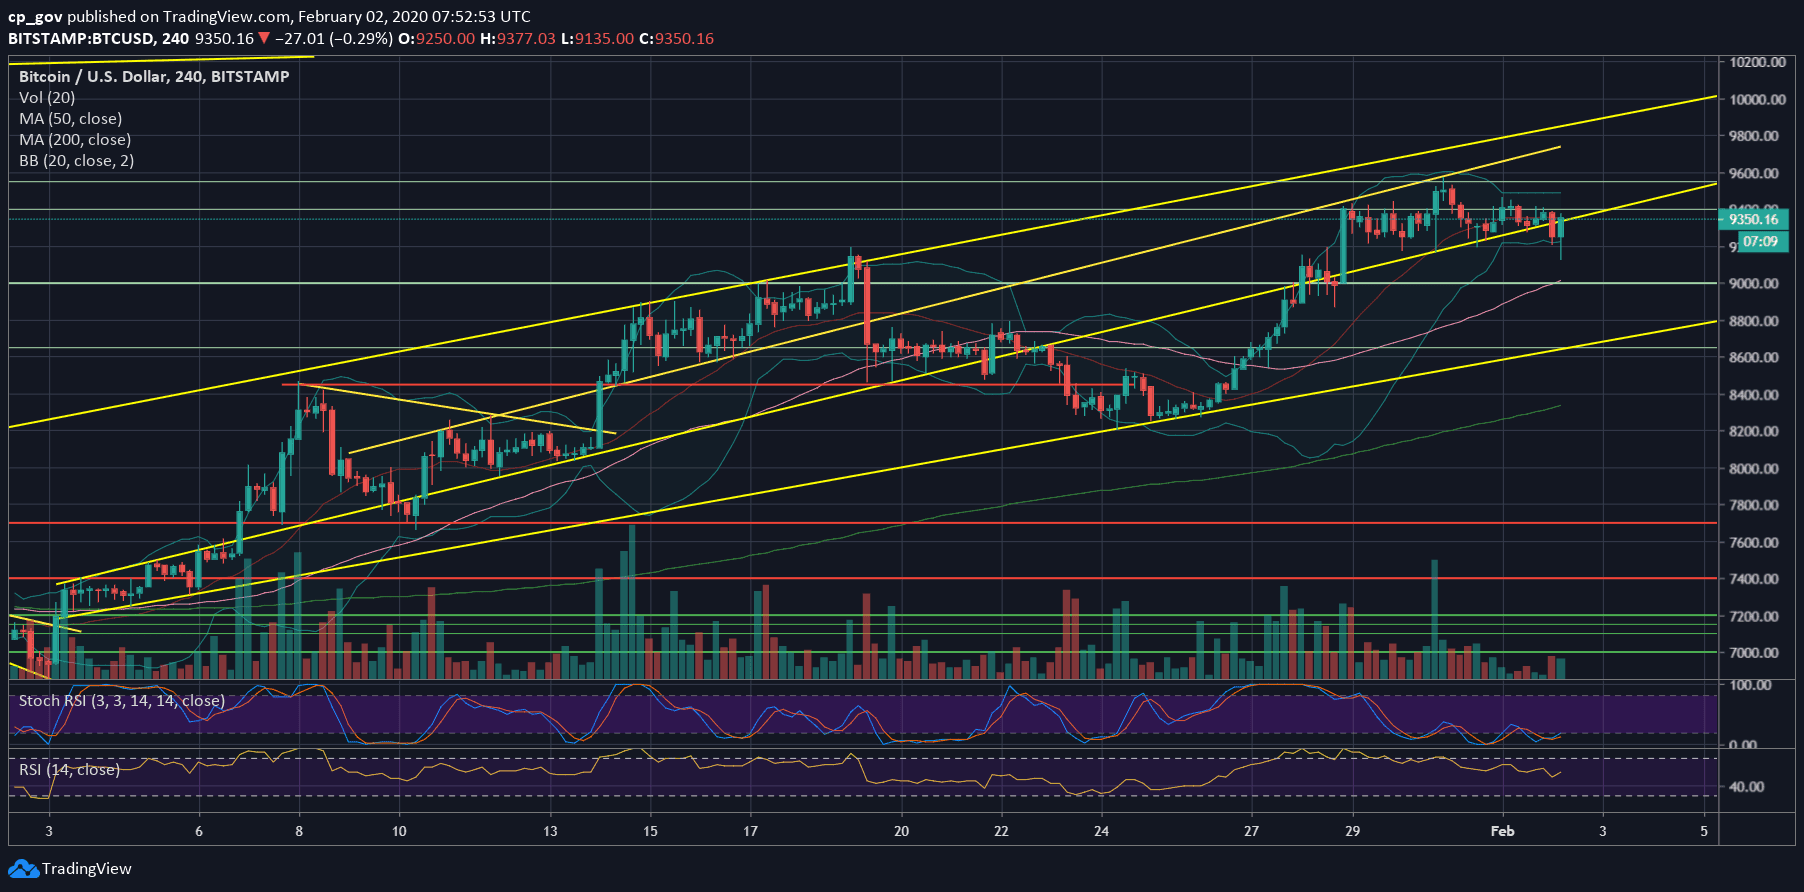
Overall, the short-term is still seeking for correction – unless the current 4-hour’s candle will close above the marked ascending trend-line (on the following chart, roughly around $9380); however, on the bigger time-frame, Bitcoin is on the right track North.
In any case, Bollinger Bands, along with the declining daily candles of trading volume are pointing on a possible huge price move which should be coming up in the next short term.
Golden Cross Coming-up?
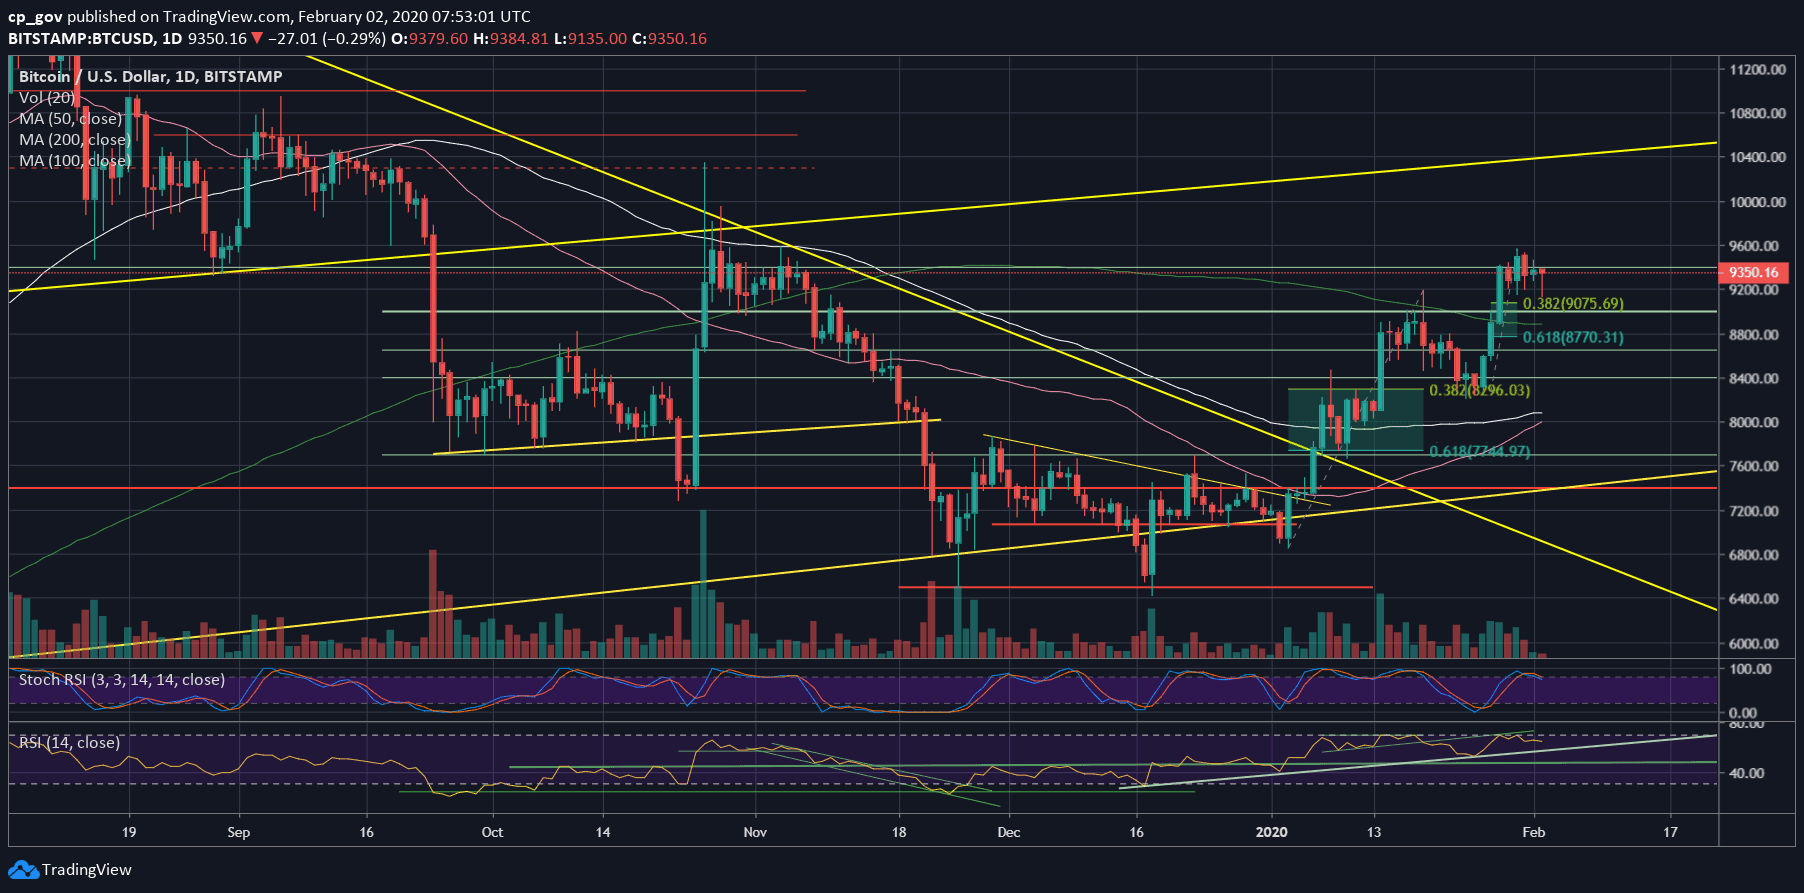
Looking on the daily chart, we can see a longer-term bullish sign reaching out to take place in the coming days: A Golden Cross between the 50 and the 100 moving average lines. This indicator, which is usually lagging, is an important momentum indicator, and it happens as the MA-50 (marked by pink line) crosses above the MA-100 (white line).
This is the “little brother” of the Golden Cross by definition, between the MA-50 and the MA-200 (the light green line, currently around $8900). If Bitcoin continues its bullish track, we might see this kind of cross in the next 1-2 months.
Total Market Cap: $259.2 billion
Bitcoin Market Cap: $170 billion
BTC Dominance Index: 65.7%
*Data by CoinGecko
Key Levels To Watch & Next Targets
– Support/Resistance levels: Bitcoin is now back again at the confluence zone between $9300 – $9400. Failing to hold this level, and the 4-hour’s ascending trend-line will trigger a further correction. The first level of support might be $9200, before the $9075 which is the 38.2% Fibonacci retracement level of the recent bullish move.
Down below lies $9000 and $8900, along with the significant 200-days moving average line. Further below is the Golden Fib level – 61.8% – at $8770.
From the bullish side, the first level of resistance is the $9450 area (a recent top) before the 2020 high at $9550 – $9570. Further above lies the $9800 old resistance zone along with the top-ascending trend-line as shown on the 4-hour chart.
– The RSI Indicator: As we pointed out here on the previous price analysis, the bearish divergence had resulted in a $300 correction (so far, as of today).
Overall, the RSI seems to have some more room to go lower, along with the Stochastic RSI oscillator that had recently gone through a bearish cross-over and now just entered the neutral territory. This might trigger a deeper correction.
– Trading volume: For almost a week, the volume is declining. This might reveal a more significant price move is coming up soon, as the new trading week would start tomorrow (Monday).
BTC/USD BitStamp 4-Hour Chart
BTC/USD BitStamp 1-Day Chart
Enjoy reading? Please share:
Disclaimer: Information found on CryptoPotato is those of writers quoted. It does not represent the opinions of CryptoPotato on whether to buy, sell, or hold any investments. You are advised to conduct your own research before making any investment decisions. Use provided information at your own risk. See Disclaimer for more information.
Cryptocurrency charts by TradingView.
