
Tron (TRX) Price Analysis – January 11
The technical indicator for Tron (TRX) is still holding on the positive side after the recent price drop in the market.
TRX/USD Market
Key Levels:
Resistance levels: $0.0160, $0.0165, 0.0170
Support levels: $0.0135, $0.0130, $0.0125
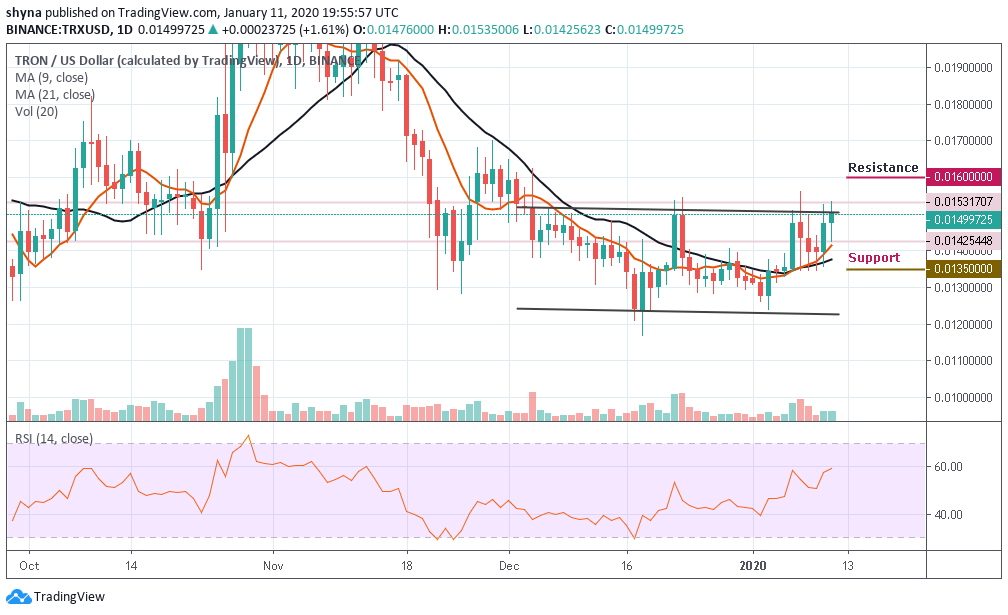
Tron’s price is steadily maintaining a higher high and higher low over the past few days, making the market to touch $0.0155 on January 7. A couple of days ago, the price of TRX dropped to $0.0139 after a slight pullback in the market. Despite the drop, today, the TRX market is currently up by +1.61% while the price is moving above the 9-day and 21-day moving averages, bringing the market under the bull radar.
However, in as much the TRX/USD pair continues to shape within the channel, we can expect the market to keep maintaining a bullish moment before the price could hit the target resistance level. But if the price actions drive beneath the moving averages, the coin may fall to $0.035, $0.0130 and $0.0125 support levels.
Moreover, a further dropping may cause the market to retest the $0.0130 support. Should the market bounce back, we may see the next buying pressure towards the $.0160, $0.0165 and $0.0170 resistance. Nevertheless, TRX is still maintaining a bullish trend on the daily chart as the RSI (14) moves towards the 60-level.
TRX/BTC Market
Against Bitcoin, Tron (TRX) is trading on the upside, although the price action is still below the moving averages. As the trading volume coming up slowly, if the selling pressure resumes, the TRX price variation may likely begin the downtrend. For now, the RSI (14) moves above the 45-level which makes the market to be strong at the uptrend movement.
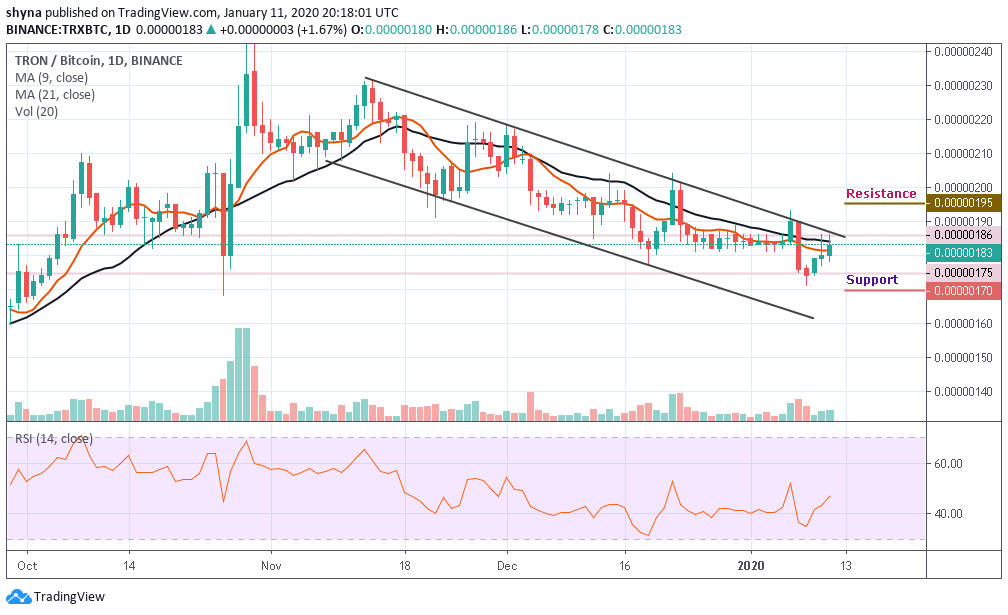
Nevertheless, as the price move to break out of the channel at 186 SAT. We can expect close resistance at the 190 SAT before breaking to 195 SAT and potentially 200 SAT levels. Moreover, if the bearish steps-in and validate a break below the 9-day MA; we can then confirm a downtrend for the market and the closest support levels lie at 170 SAT, 165 SAT, and 160 SAT.
Please note: Cryptovibes.com is not a financial advisor. Do your research before investing your funds in any financial asset or presented product or event. We are not responsible for your investing results.
