The polar vortex is once again causing many of us to reach for long underwear and heavy sweaters. But because the Arctic is warming nearly three times faster than the rest of the planet, the Arctic air advancing into the U.S. isn’t as cold as it used to be.
Climate Central looked at the annual lowest temperatures at 244 locations across the U.S and found that 98% have recorded a rise of at least 1°F in their yearly coldest temperature since 1970. Just 2% experienced a decrease of at least 1°F. The average trend across these cities is a 7°F rise, and 42 cities have recorded an increase of 10°F or more. And the warming trend is happening in cities across the country: Boise, Idaho (16°F), Albany, N.Y. (14°F), Minneapolis (12°F), Nashville, Tenn. (14°F), and Anchorage, Alaska (12°F).
Not every outbreak of bitter cold can be attributed to the polar vortex. First, the polar vortex is always present, strengthening in the cold months. It is a fundamental feature of the atmosphere, a fast moving current of air encircling the Arctic that forms because of the increased temperature difference between the dark, frigid Arctic air and milder air away from the poles. There are actually two vortices, one in the layer of the upper atmosphere known as the stratosphere and one in the lower section, where our weather happens, called the troposphere. These two features interact with each other and can affect the weather outside of the Arctic. When the tropospheric polar vortex buckles or expands, and the jet stream slides to the south, it brings cold air with it. And we all need extra blankets.
Less extreme cold may sound great to those of us who don’t like the cold. But the warmer winters we have been experiencing impact other seasons. Shorter winters can make fall last longer and spring start earlier meaning longer allergy seasons and extended seasons for ticks and mosquitoes. And of course, warmer winters threaten ice fishing, skiing, pond hockey, and other outdoor recreation.
METHODOLOGY
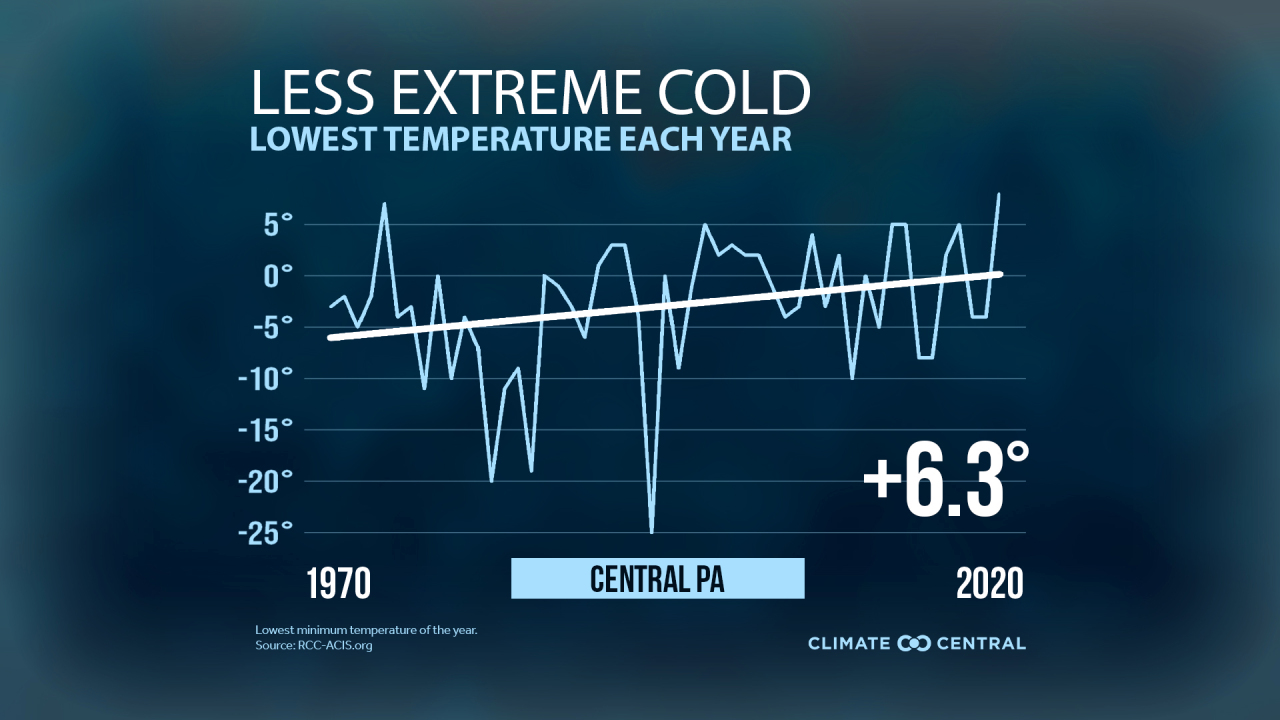
Annual minimum temperature trends from 1970 to 2020 were calculated using data from the Applied Climate Information System. Displayed trend lines are based on a mathematical linear regression.
