
Gold (XAU/USD) is holding the higher amidst persistent downbeat mood seen around the US dollar, as the optimism over an imminent Brexit deal dents greenback’s safe-haven appeal. Additionally, expectations of a US stimulus deal continue to bode well for the metal, as markets ignored President Donald Trump’s call to amend a $900bn covid relief bill.
Pre-Christmas light trading is likely to persist, which could exaggerate the price movements. How is gold positioned on the charts?
Gold Price Chart: Key resistances and supports
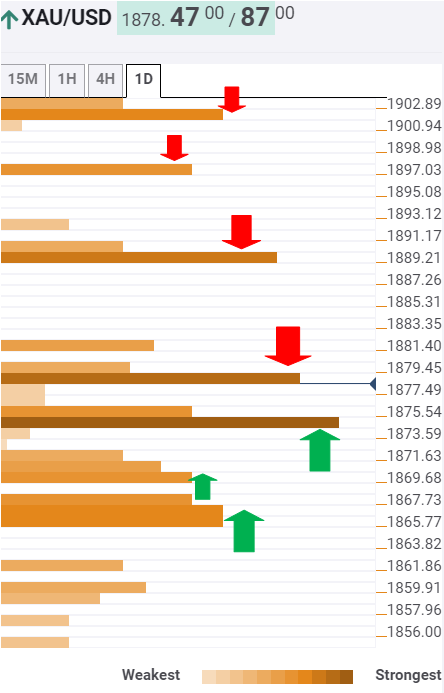
The Technical Confluences Indicator shows that the XAU/USD pair is challenging a key barrier at $1880, which is the convergence of the previous day high and Fibonacci 23.6% one-week.
Acceptance above the latter could open doors towards the next major resistance at $1890, the Fibonacci 61.8% one-month.
The intersection of the previous week high and the psychological magnet near $1898-1900 will be next on the buyers’ radars.
Further north, $1902 could challenge the bulls’ commitment. That level is the SMA100 one-day.
Alternatively, any retracement could meet strong demand at $1875, where the SMA5 four-hour coincides with the previous low four-hour and Fibonacci 23.6% one-day.
The next cushion awaits at $1869, the confluence of the SMA50 one-day and SMA10 four-hour.
The bears need a sustained break below $1866 to unleash additional downside. At that point a dense cluster of support levels is stacked up, comprising of Fibonacci 38.2% one-week, Fibonacci 61.8% one-day and SMA50 four-hour.
Here is how it looks on the tool
About Confluence Detector
The TCI (Technical Confluences Indicator) is a tool to locate and point out those price levels where there is a congestion of indicators, moving averages, Fibonacci levels, Pivot Points, etc. Knowing where these congestion points are located is very useful for the trader, and can be used as a basis for different strategies.