
Growing up, I was a huge fan of the sci-fi classic series, “Dune”, by Frank Herbert, arguably the precursor and premise to everyone’s beloved Star Wars.
One of my favorite lines, memorialized in sci-fi fandom, came from the lips of the desert-reborn hero, Paul Maudib, who cries out to his father and the Universe: “the Sleeper has Awakened” as Maudib announces that he has passed the inflection point of mediocrity into one of true strength and power (no longer to be underestimated by others).
Dune is on tap for an upcoming reboot, and, like Dune, I believe Sleep Number Corporation (SNBR) is slated for its own “reboot” on its share price, having been underestimated by the investment community, but in its own hero’s journey will prove itself too as it reaches its own position of strength and momentum this next quarter.
This article will provide a brief overview of bedding industry trends with a focus on SNBR, analyze its recent financial performance, provide near-term financial forecasts, and end with a ranged price target valuation.
Company Overview
The Bedding Sector
The bedding sector was on a tear from 2019 until the onset of Covid-19, driven by ongoing consolidation of “bed-in-a-box” industry players combined with a variety of antidumping legislation targeting Chinese imports of lower-end beds. Covid-19, while severe, resulted in a short-lived “Hyper-V” drop in industry sales as the sector soon regained its momentum:
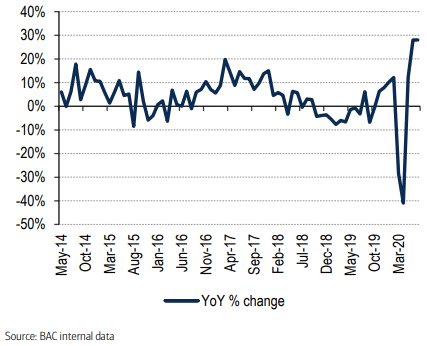
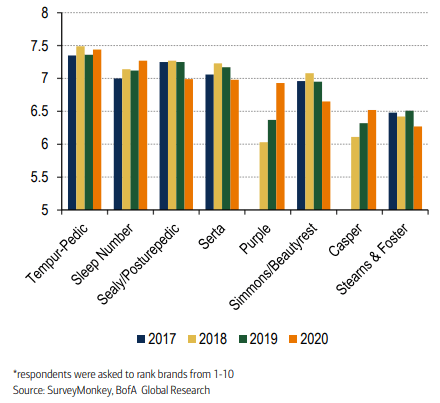
Source: (BofA Global Research Bedding Survey as of 9/9/20)
The recent annual survey (shown above) by BofA Global Research from September 9, 2020, indicated that the bedding sector is expected to grow by 3% going into 2021:
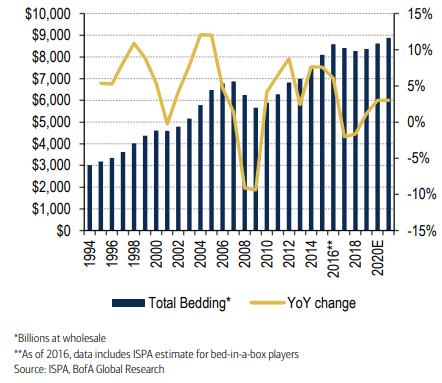
Source: BofA Equity Research Report 9/9/20
Already, one peer group member, Tempur Sealy International (TPX) has publicly announced that:
quarter-to-date order trends have improved from previous expectations and the Company now estimates total third quarter net sales to grow more than 30% compared to prior year. The change in expectation was primarily driven by improving order trends…”….” We continue to see strong growth that is broad-based across geographies and channels.”
Source: TPX Press Release 9/14/20
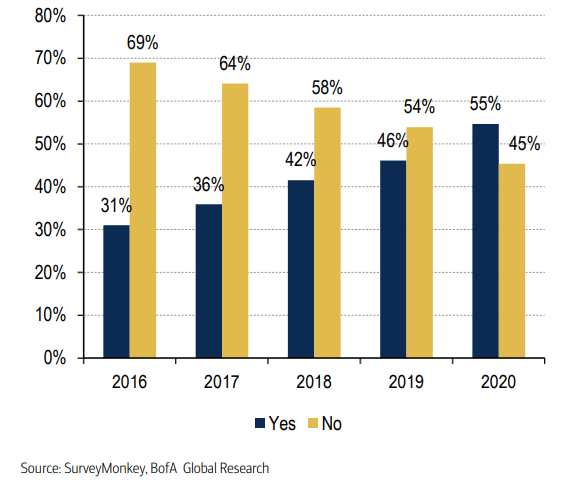
This is in part driven by the proportional shift in the percentages of people that are “likely” or “extremely likely” to purchase a bed within two years as savings rates rise, the work-from-home environment persists, and a more comfortable home environment becomes a higher priority. As such, the likelihood of those people buying a bed has risen by 21.4% from a collective historical average of 28% (i.e., 2016-2019) to 34%:
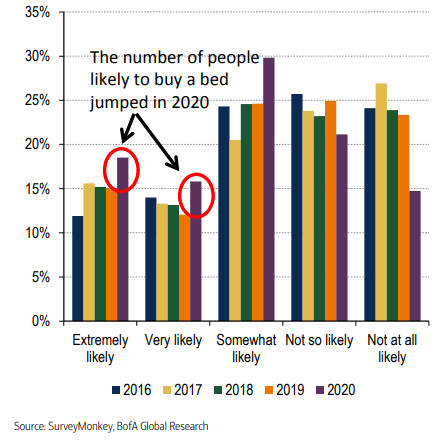
Source: BofA Equity Research Report 9/9/20
As the demand continues to rise, the product price mix has shifted towards higher-end SKUs as 16% of consumers purchasing beds have plans to spend over $2,000 (a 45% increase vs. the 4-year prior average of 11%):
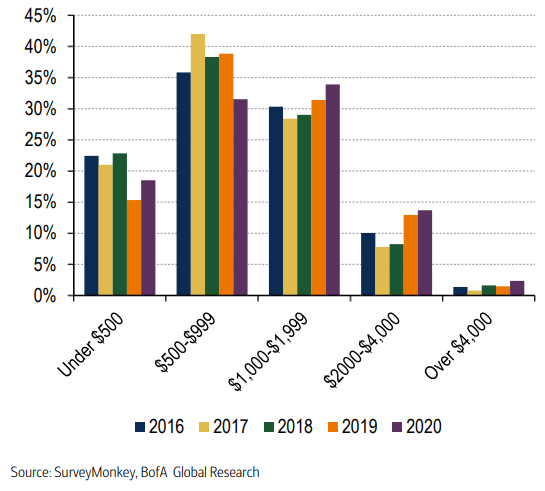
Source: BofA Equity Research Report 9/9/20
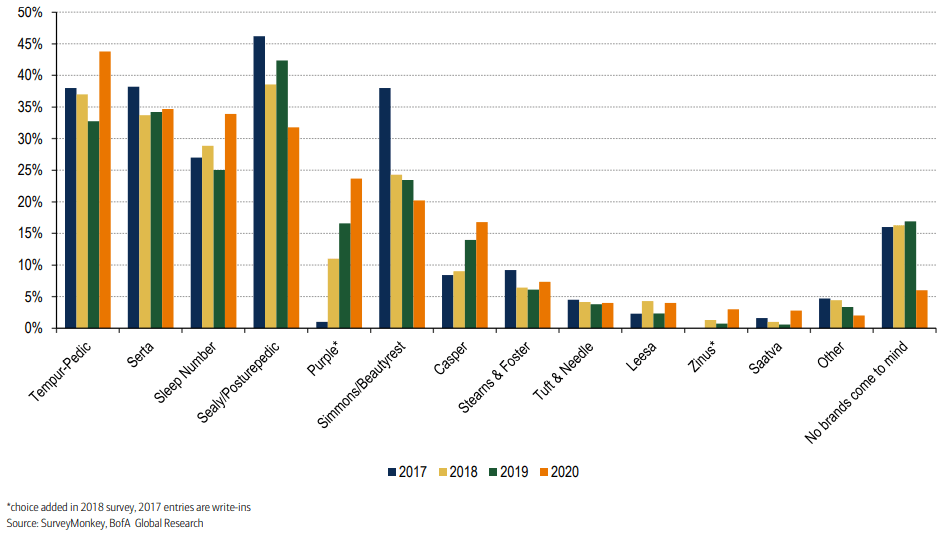
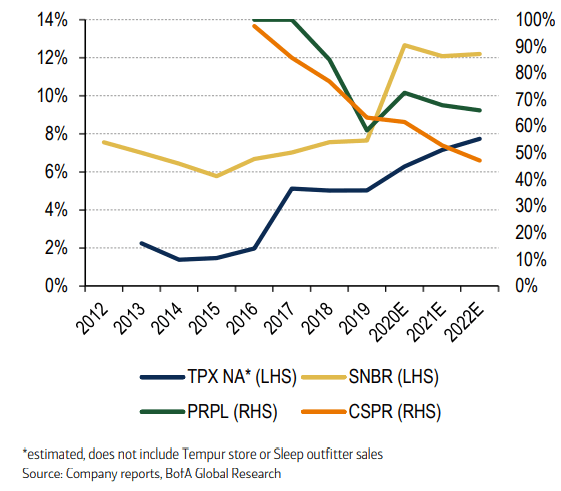
The largest market leaders are best suited to take advantage of this opportunity from a brand perspective and are gaining market share relative to the prior year 2019 BofA survey results (with SNBR seeing the largest % growth in market share among the top 3 leaders):
- Tempurpedic (increasing ~33% from 33% to 44% YoY)
- Serta (increasing ~3% from 34% to 35% YoY)
- Sleep Number (increasing ~36% from 25% to 34% YoY and also rising from #4 to a #3 position)
…all at the sacrifice of share from brands such as Sealy and Simmons.
Source: BofA Equity Research Report 9/9/20
Most of us grew up hearing that famous question “What’s Your Sleep Number?”. Sleep Number is a technology and brand all to its own. It is the only market leader for their segment of the air-adjustable mattresses that has developed a nationwide direct-to-consumer integrated channel through careful management of a brick & mortar platform over the years and supporting it with various touchpoints of digital/chat & phone capabilities.
Sleep Number’s success is in part driven by industry tailwinds in market share preferences for Air Adjustable (e.g., Sleep Number), Hybrid (e.g., Serta), and Memory Foam (e.g., Tempur) mattresses in lieu of traditional innerspring mattresses which have lost ground:
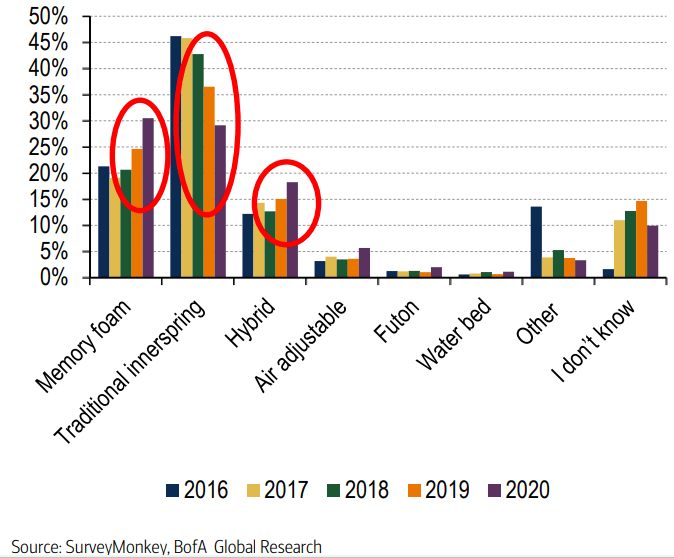
Source: BofA Equity Research Report 9/9/20
CEO, Shelly Ibach, noted in SNBR’s Q2 2020 earnings call, that SNBR plans to take advantage of the above consumer preference switch by targetting advertising and increasing marketing efforts with brand influencers who are advocates of the product. The age-old adage rings true “your best customer is your customer”:
We prioritize our marketing efforts on loyal insiders and brand advocates [which is] a powerful competitive advantage which represents our most efficient source of sales.”
SNBR CEO, Shelly Ibach
When asked what brand advertisements respondents from the BofA survey had seen most frequently in the past two months, Sleep Number claimed the #1 spot at 42% of mindshare outpacing all other brands including Purple Innovation (PRPL).
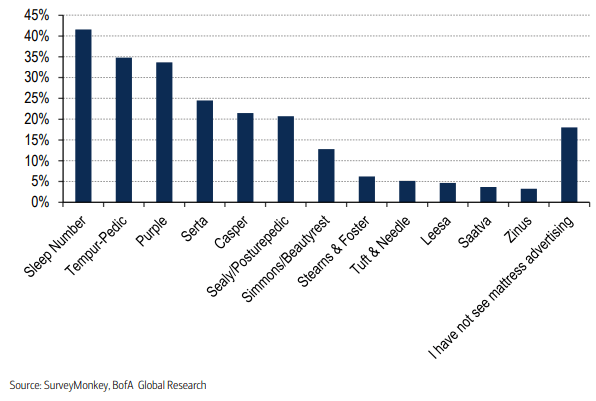
Source: BofA Equity Research Report 9/9/20
The Company
SNBR during the crux of the Covid-19 crisis managed to pivot to an integrated virtual relationship nationwide despite only having a small percentage of the stores open throughout most of the quarter (although recovering rapidly month-to-month):
- 23% average in April
- 47% average in May
- 81% average in June
With more than 95% of the stores open as of July 15, 2020
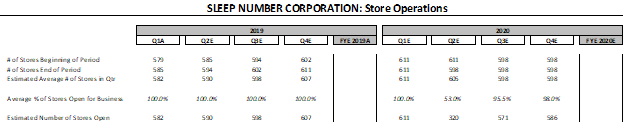
Source: Author Generated Analysis
As a result of the closures, revenue per store fell QoQ but still outperformed on a YoY basis as the operational performance of the remaining ~320 stores (~53% of total) during the quarter outperformed historical averages:
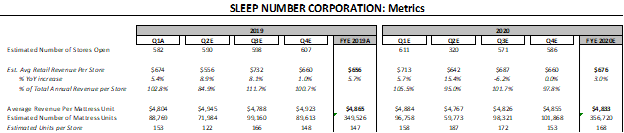
Source: Author Generated Analysis
SNBR still managed to close out Q2 with net sales of $285MM (down only ~20% YoY) with almost half the footprint of stores. One note: You can see from above that the average revenue per unit (ARU) was down ~4% YoY due to product mix shifts, but SNBR expects this to return back to more normalized levels over time as the economy reopens and exits the Covid-19 environment.
SNBR witnessed single-digit demand growth in May and June YoY but, more importantly, outperformed in its online/phone/chat sales segments which witnessed 200%+ growth YoY (surpassing all of 2019 total corresponding revenues and changing the paradigm of its business as a result).
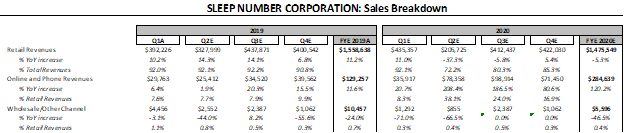
Source: Author Generated Analysis
This resulted in ~$87MM in operating cash flows (YTD 2020), far exceeding SNBR’s internal expectations. SNBR has since allocated the majority of the proceeds to focus on debt paydown, leaving a net debt position of ~$246MM and equivalently a leverage ratio of 2.8x Net Debt/EBITDAR: well below the SNBR’s covenant restrictions of 4.5x Net Debt/EBITDAR and well within the company’s target range of 2.5x -3.0x EBITDAR.
The key to their success was in the targeted increased media shift into digital resulting in a step up in digital traffic from Q1. That coupled with financing/promotions actually reduced overall media spend but also lead to far more efficient use of capital as markets shifted to more and more customers to redirect their purchasing behavior online by ~20% YoY:
percentage of respondents considering buying a bed online
Source: BofA Equity Research Report 9/9/20
SNBR has been increasing its online media spend and digital footprint resulting in a significant QoQ increase from Q1 to Q2 and is still expecting to see triple-digit growth in its online media channels YoY for Q3 (although I suspect that growth will begin to slow from its highs in Q3 as the economy continues to re-open- refer to my quarterly forecasts as noted above).
We can gain a directional sense of how Q3 performed by looking at just the website traffic trends for SNBR. In examining the traffic rankings, we can already see a ~50% improvement (i.e., reduction in rank) in SNBR’s traffic ranking from May 1st through the end of Q3:
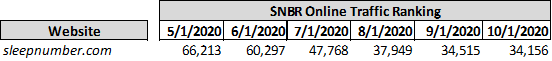
Source: Author’s Compilation of Alexa SNBR Online Traffic Data
While the data above may seem simple, it is vastly important because it provides a clearer picture of the digital performance since the end of Q2. From this information, we know that traffic continued to increase throughout Q3 by a significant amount (even more so than in Q2).
It is my belief that SNBR will have another record quarter in terms of its online/phone/chat associated revenues in Q3 (and my forecasts noted in the earlier financials are actually more conservative than the actual online traffic data would suggest) as online sales continue to grow as a percentage of total sales:
Online Sales as a percentage of total sales
Source: BofA Equity Research Report 9/9/20
This will enable SNBR to capitalize on the anticipated online-centric brand purchases that are expected to increase industrywide by 109% YoY compared to 2019.
As a result of all its recent targeted and efficient advertising spend, SNBR has already and will continue to move up the brand rankings from the #4 to #2 position in online brands (overtaking Sealy/Posturepedic and Serta):
Source: BofA Equity Research Report 9/9/20
Looking towards the future and into 2021
SNBR has a new Scientific Advisory Board studying human sleep patterns (i.e., SNBR has data covering over “1 billion total sleep sessions of longitudinal sleep and biometric data points”) and working on new ways to improve and extend periods of sleep. SNBR has a series of new technology and software enhancements that are targeted to be rolled out to meet various customer needs:
- Circadian rhythms insights
- Personalized sleep wellness reports
- Proven quality sleep
Additional features that are in process and slated for 2021 include:
- Individual heart rate variability insights
- M7 and M10 360 Smart Beds featuring temperature-balancing layers
- Introduction of a climate 360 bed (discussed in the Q2 Earnings Call)
According to the earnings call, this stems from the most recent acquisition of the patent portfolio from Gentherm, the global developer of thermal management technologies. This brings the cooling and heating technology that SNBR relies upon under the corporate umbrella and fortifies its integrated model. With these upcoming advances in technology and ongoing connected health research, SNBR will be able to provide ongoing support to justify higher price points going forward.
As such, I expect SNBR’s top-line performance to exceed historic quarterly performance from 2019 and the first half of 2020.
Margins are expected to improve as well, per management’s Q2 earnings call, as Q2’s lower unit volumes and operational inefficiencies resulted in a temporary 380 bps impact leading to a gross margin of 57.2%.
As the company continues to integrate sales through multiple touchpoints: stores, online, and chat, they will likely see further improvement on margins as price points have been shown historically to expand as the number of touch points and communications with customers rises:
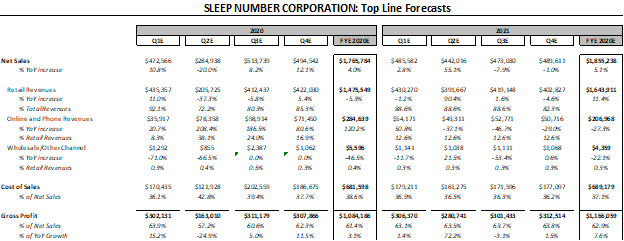
Source: Author Generated Analysis
Equivalently, I believe that bottom line forecasts (see below) will be equally as attractive, as EBITDA (and corresponding cash flows) will improve, allowing for enhanced capital allocations going into 2021.
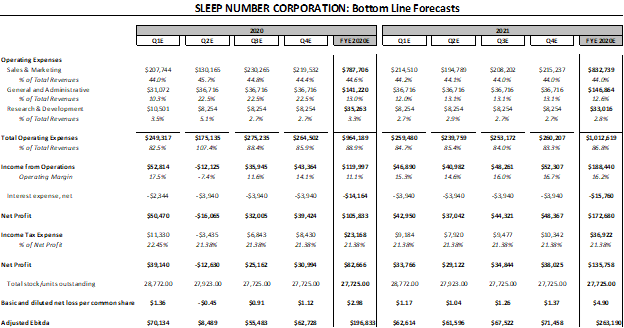
Source: Author Generated Analysis
Capital Allocation
Given where the current net debt levels are, I don’t expect further significant reductions on debt (as they are the company’s target leverage ratio range) and suspect SNBR will continue to focus allocating capital towards expanding the national footprint, research and development, and share repurchases (which were previously halted in mid-March).
The company, given its 2021 EBITDA projections and a historic EBITDA to FCF conversion rate of ~70-80%, sports a low double-digit FCF yield between ~11% and ~13% as of 10/12/2020. This is significantly higher than the industry norms of 4-5% and represents an attractive opportunity for SNBR to reestablish the share repurchase program as an attractive investment opportunity within itself.
Risks
There have been two key bear arguments I have seen from the analyst community:
- SNBR has been focused on growth through an expanded footprint of stores rather than driving comparable store sales growth
- Declining average revenue per unit is a concern
On the first point, I view SNBR as a cash cow and not a growth play. While comparable store growth is not a key part of SNBR’s story, I believe their integrated model and growth through expansion is an opportunity to drive top line sales resulting in the same end result: “growing cash flows”. SNBR’s strategy of expanding the various digital and brick & mortar touchpoints on the customer has and will continue to yield higher sales. Since these channels/touchpoints are connected, it is not as relevant to try and disaggregate the sales between the channels (e.g., trying to identify what came from online vs. store channels) and to focus on the collective since they work in collaboration with each other. Collectively, this will show “comp stores” growth in the integrated digital/brick and mortar business model.
On the second point, I believe this is a temporary situation (as discussed earlier) resulting from a product mix shift. Additionally (as shown earlier), survey data has shown that consumers are shifting their willingness to pay higher price points for a better product.
So, what is my Sleep Number?
As of October 9, 2020, SNBR shares were trading at $55.5/share. Based on my financial forecasts (as shown above) and the following corporate data: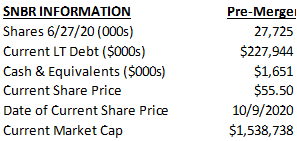
Source: Author Compilation
“My Sleep Number” is a target share price of ~$72 per share representing a ~30% return (based on Friday’s 10/9/20 closing share price of $55.5 per share).
This is based on my earlier financial forecasts as well as selected EBITDA and EPS trading multiple valuation methods (as shown below). These methods reflect historical trading multiples on the high end of the multiple range and current trading multiples for the peer group on base end, and then a “worst” reflecting a lower discounted range to model out a “bear” case scenario.
This is an underestimate, in my opinion, with upside risk due to my conservative stance in the forecasts presented above for online growth which I believe may be an underestimate of the actual online revenue performance:
EBITDA AND EPS VALUATION METHODS
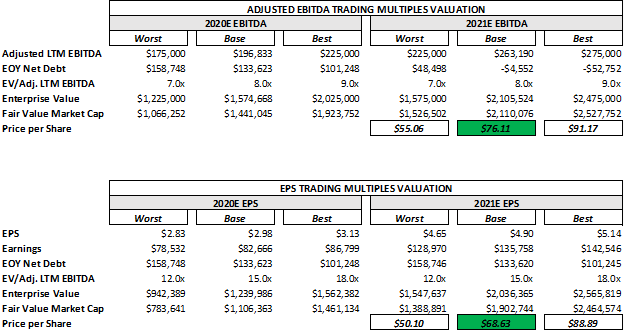
Source: Author Analysis
Note: I assumed for this analysis that all cash flows (which will reflect a stabilized cash flow stream for 2021 and beyond) would be directed towards debt repayment for this valuation (as it is unclear how much would be allocated between debt repayment, share repurchases, and growth capex).
Conclusions
Sleep Number Corporation’s upcoming earnings calls for the remainder of 2020 and throughout 2021, like Maudib, will likely awaken shareholder value as SNBR executes on its digital and brick and mortar strategy. The bears who have underestimated SNBR’s integrated platform will come to appreciate the cash cow generation potential of SNBR. Leverage and liquidity are and will not be an issue for the firm, and SNBR’s resilience during the worst of the Covid-19 pandemic has already demonstrated the value of an integrated platform should there be a second wave of Covid-19.
As industry demand continues to expand and shift towards online purchases as well as higher price-point associated with new technology and better quality products, SNBR will continue to gain market share from more traditional innerspring vendors.
So, as you go to sleep tonight and wake up the next morning before the earnings call, all refreshed and energized like our hero Maudib and are thinking about whether to buy or not, stop and ask yourself “What’s My Sleep Number?” and just know that mine is $72/share and I am long on this undervalued security and, more importantly, I am not losing any sleep over it.
Disclosure: I am/we are long SNBR. I wrote this article myself, and it expresses my own opinions. I am not receiving compensation for it (other than from Seeking Alpha). I have no business relationship with any company whose stock is mentioned in this article.
Additional disclosure: If you liked what you read, please click the “Like” button below and follow me. We truly pride ourselves on conducting extensive primary & secondary research, analyses, and/or interviews with Senior Management, Partners, and/or Customers in order to identify and vet undervalued investment opportunities. That said, we aren’t always right and these are just our humble opinions. Don’t get us wrong, we would love for you to follow us to show you the “hidden” gems we find, but we also always encourage everyone to do their own homework and research and as the saying goes… BUYER BEWARE. In the meantime, Happy investing!
