
- Chainlink has now dropped by a total of 27% over the past week as it crashes beneath $9.00 today.
- The coin is trading at support at the July high-day closing price as the bulls attempt to stall the downtrend.
- Against Bitcoin, LINK has fallen into the support at the .618 Fib Retracement at 0.000826 BTC.
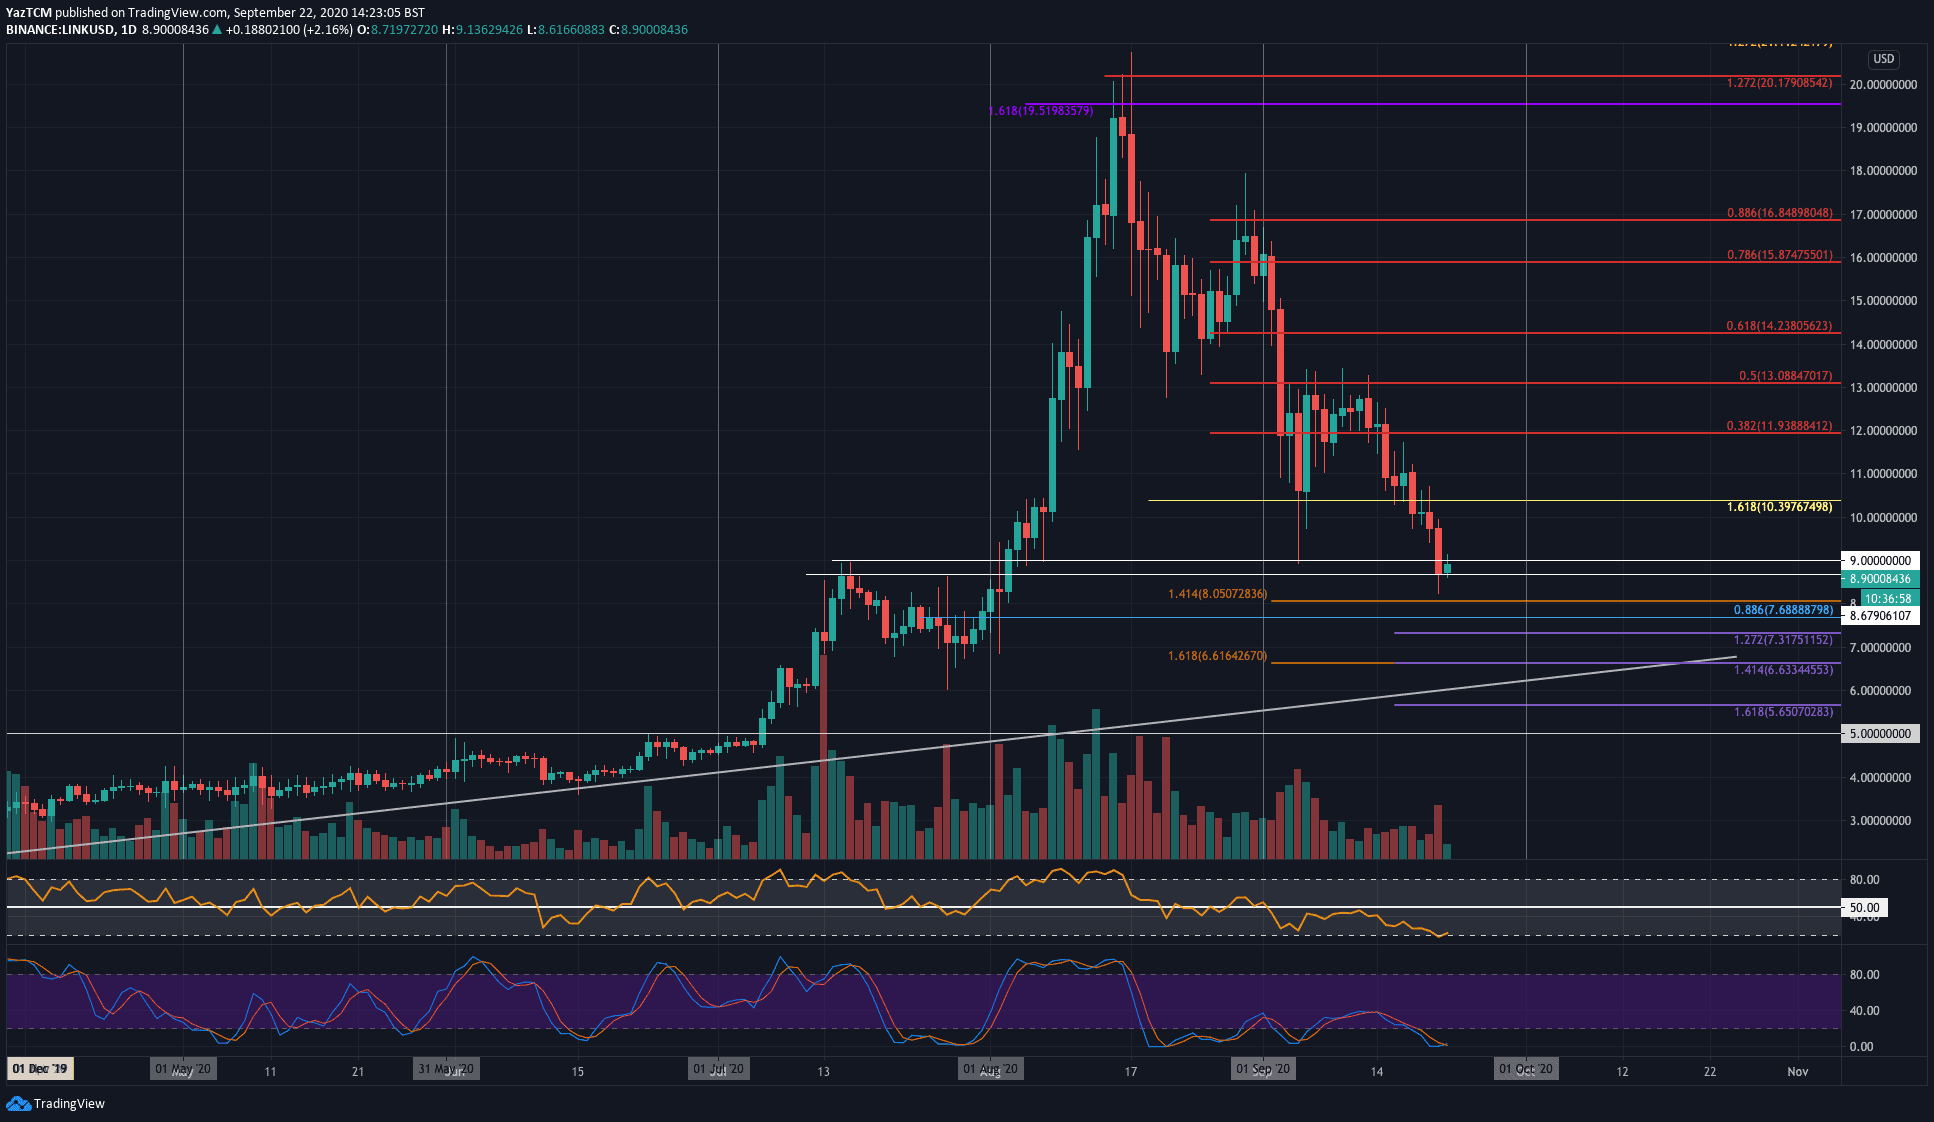
LINK/USD – Bearish Momentum Reaches Oversold Conditions
Key Support Levels: $8.67, $8.05, $7.66.
Key Resistance Levels: $9, $10, $10.40.
Five days ago, LINK penetrated beneath crucial support at the $10.40 level (downside 1.618 Fib Extension), which stalled the market decline during the early September price fall. Since then, LINK broke below $10 and continued down until it found support yesterday at the $8.67 level – the July high-day closing price.
LINK had spiked lower toward $8.20 yesterday, but the bulls recovered to allow the daily candle to close above the aforementioned support at $8.67.
With LINK creating another fresh low for September yesterday, it does seem like the buyers have left the market. If the sellers push beneath the $8.00 level, LINK can be expected to continue much lower until support is met around $6.00.
LINK-USD Short Term Price Prediction
If the sellers push beneath $8.67, the first level of support lies at $8.05 (downside 1.414 Fib Extension). This is followed by support at $7.66 (.886 Fib Retracement), $7.00 (July support), and $6.60 (downside 1.618 Fib Extension). The last level of support to highlight lies at $6.00 as the rising trend is located here.
On the other side, resistance first lies at $9.00. Beyond this, additional resistance is found at $10, $10.40, $11.90 (bearish .382 Fib Retracement), and $13 (bearish .5 Fib Retracement).
The RSI has finally reached extremely oversold conditions and has bounced slightly. This could suggest the sellers are overextended and might take a break from their bearish activity. Additionally, the Stochastic RSI is in the process of producing a bullish crossover signal.
LINK/BTC – Sellers Break 3-Month Rising Trend Line
Key Support Levels: 0.000826 BTC, 0.0008 BTC, 0.000756 BTC.
Key Resistance Levels: 0.0009 BTC, 0.00094 BTC, 0.001 BTC.
Likewise, the sellers are in control of LINK/BTC. A few days ago, the bears pushed LINK into the support at 0.000917 BTC (downside 1.618 Fib Extension). This level of support was further bolstered by a 3-month old rising trend line.
Unfortunately, the buyers could not defend this support as LINK penetrated beneath the trend line and continued lower until it reached the support at 0.000826 BTC (.618 Fib Retracement).

LINK-BTC Short Term Price Prediction
Looking ahead, if the support at 0.00826 BTC breaks, support can be found at 0.0008 BTC (downside 1.272 Fib Extension), 0.000756 BTC (downside 1.414 Fib Extension), and 0.0007 BTC.
On the other side, the first level of resistance lies at 0.0009 BTC. This is followed by resistance at 0.000943 BTC and 0.001 BTC.
The RSI has also reached extremely oversold conditions here and the Stochastic RSI is also about to produce a bullish crossover signal.
Click here to start trading on BitMEX and receive 10% discount on fees for 6 months.
Disclaimer: Information found on CryptoPotato is those of writers quoted. It does not represent the opinions of CryptoPotato on whether to buy, sell, or hold any investments. You are advised to conduct your own research before making any investment decisions. Use provided information at your own risk. See Disclaimer for more information.
Cryptocurrency charts by TradingView.