CLO equity funds are the highest-yielding assets available to retail investors, a key feature which explains their popularity. The asset class is also relatively rich across the capital structure, offering investment options beyond common shares but also preferreds and baby bonds. This allows income investors to tailor their risk/reward views across the wide opportunities on offer. The main challenge of the asset class, however, is its illiquidity which makes it difficult for investors to use the standard valuation tools. NAV is only available sporadically, leaving investors in the dark about the discount valuation of these funds and the behaviors of the underlying assets. This also has a knock-on impact on senior securities and makes it difficult to gauge their asset coverage. In this article, we discuss our approach to estimating CLO equity fund NAVs as well as recent trends in discounts.
We also discuss a number of CLO equity-linked securities that we hold across our Income Portfolios. Our highest conviction hold in the sector at the moment are the Oxford Square Capital Corp. 6.25% 2026 Notes (OXSQZ), trading at a 7.9% yield. Unlike the other CLO equity funds, the underlying portfolio is 70% senior loans with no secured debt ahead of the baby bond. This makes the security much more resilient to a severe downturn relative to other CLO equity senior securities.
Despite this more defensive profile, OXSQZ and its sister baby bond are trading in line in yield terms with the senior securities of other CLO equity funds. This disparity in pricing likely has to do with the fact that the parent company is not generally thought of as a CLO fund as it’s not structured as a CEF but as a BDC. This likely creates a kind of bifurcated market where BDC investors stay away from these baby bonds given their unusual (for a BDC) CLO holdings and CLO equity investors play more in the CEF senior security space.
Estimating CLO Equity Fund NAVs
In this section, we touch on our process of daily NAV estimation for the CLO equity CEFs. In order to be able to estimate high-frequency NAVs we need to first find high-frequency anchors which we can use as a baseline, or independent variables in statistical parlance. For this purpose we start with two funds with sizable CLO holdings that publish daily NAVs:
- XAI Octagon Floating Rate & Alternative Income Trust (XFLT)
- Ares Dynamic Credit Allocation Fund (ARDC)
XFLT holds about 33% in CLO equity with another 14% in CLO debt with the rest in loans. ARDC holds about a quarter of the fund in CLO debt and 9% in CLO equity.
We regress NAV returns between these two funds and each fund for which we try to estimate NAV. If the relationship looks robust we then project forward the NAV of the given CLO fund using the regression coefficients and daily changes of the baseline funds.
Before we dive in it’s important to outline the limitations of this approach. First, the base funds do not have as high levels of equity holdings as the two CLO equity funds. This will limit the ability of the base funds to “predict” the NAV movements in the CLO funds.
Secondly, the composition of all funds can and does change periodically. For example, the holdings of CLO debt by ARDC have grown through time. This type of change will not be accurately captured in a static analysis such as a linear regression and will add noise to the analysis and conclusions.
Thirdly, because CLO equity are typically level 3 assets, it means that different individual transactions by the fund and different relationships with pricing services and brokers can easily lead to different prices. Individual holdings can make a big difference as well, particularly shifting portfolio loan composition, repayments or CLO-level overcollateralization and coverage tests. And because CLO equity assets are generally considered to be leveraged around 10x all of these factors will be magnified to a much greater extent than for more ordinary securities.
Finally, we have to be mindful that even if our limited approach proves to be robust, the market has clearly shown that CLO funds are different from other funds in that the demand for the funds appears to be divorced from the discount valuation picture making this type of analysis less useful for forecasting returns. That said, a “margin of safety” approach should still favor more deeply discounted funds, all else equal.
Over the last few months our model has done a good job of estimating NAVs with respect to actual subsequently published official figures. Overall, the estimate has tended to err on a slightly higher NAV than actual. This is likely due to two main factors – changes in leverage both across the CLO equity funds as well as the funds used in the regression estimates. And secondly, it has to do with the significant lag of CLO equity price recovery despite credit spreads that have mostly retraced their widening.
This is because CLO equity tranches are highly sensitive to ratings of the underlying portfolios and the recent wave of downgrades has caused many tranches to begin to fail their coverage tests. When this happens cash flow begins to be diverted away to more senior tranches which causes equity prices to remain depressed. For example, the Oxford Lane Capital Corp. (OXLC) has said that as of June 13% of their equity tranches have seen cash flow diverted. As of April, the OFS Credit Company (OCCI) saw 82% of its CLO portfolio continue to make payments.
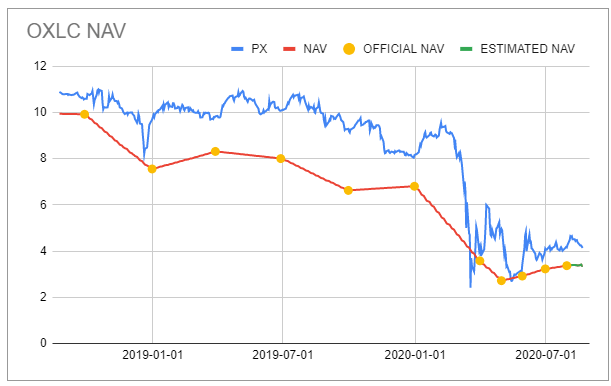
To touch on the actual recent estimates for the two largest funds in the sector, in early August, OXLC published their July NAV of $3.30, an increase of 2.1% from the prior month. Our forecast for this month was $3.37, or an increase of 4.3%. The fund continues to trade at a fairly high premium as the chart below shows. Our current premium estimate for the fund is 23%, which sounds high but it’s not far off from where the fund used to trade prior to the drawdown.

Source: Systematic Income
Later in August, the Eagle Point Credit Company (ECC) published its July NAV of $7.87, an increase of 5.6% from the prior month. Our estimate was $7.74 or an increase of 3.9%. The fund’s price has tended to trade much closer to its NAV than it did prior to the drawdown as the chart below shows.
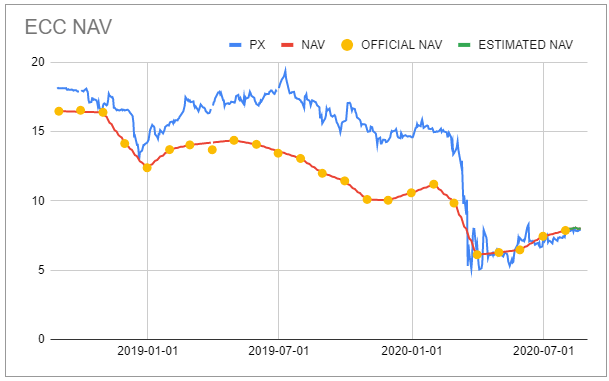
Source: Systematic Income
CLO Equity Fund Views
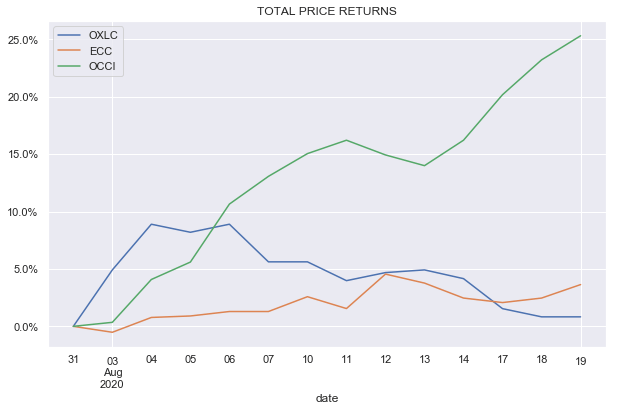
In this section, we take a look at the action in the common shares of the CEFs. The chart below shows the normalized NAV trajectory of the funds in the sector.
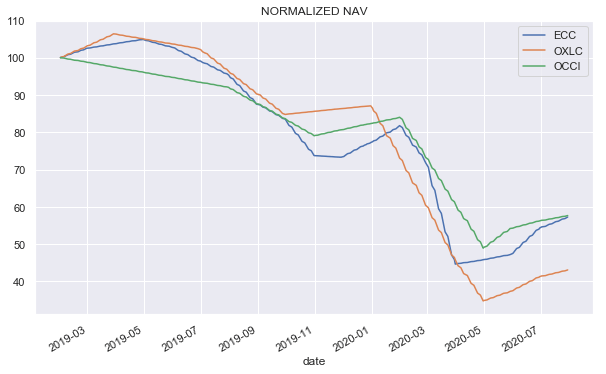
Source: Systematic Income
There is a clear performance divergence between OXLC and the other two funds. OXLC has lagged for 4 reasons in our view. First, it had a relatively higher allocation to CLO equity which have fallen more in price. Secondly, it had a harder deleveraging because of its relatively more fragile use of repo as a financing instrument. Thirdly, its portfolio has a relatively shorter reinvestment period allowing less time for CLO tranches to be able to take advantage of an environment of wider credit spreads and likely leading to a larger drawdown. And fourthly, it has a more market-based asset marking process which likely resulted in lower prices, all else equal.
We have avoided an allocation to OXLC in large part due to its consistent trading at a premium as shown in the chart below. In recent months, the fund’s premium has traded between 20-40% – a figure which cuts off a huge chunk of the fund’s earnings yield that ultimately goes to investors.
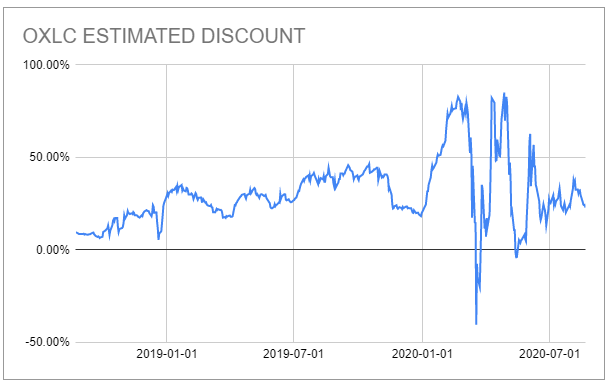
Source: Systematic Income
Instead, we have maintained a small allocation to OCCI whose discount, until recently, was extremely attractive. Since then, the market appears to have caught up with this view and the discount has essentially disappeared.
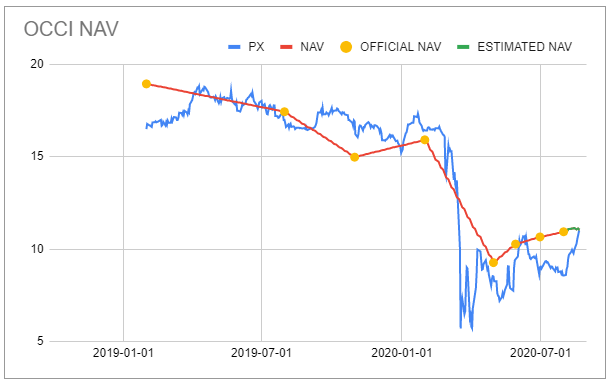
Source: Systematic Income
This caused the fund to hugely outperform its counterparts in the month of August. This extreme shift in valuation has caused us to temper our allocation to the fund in the High Income Portfolio.
Source: Systematic Income
CLO Senior Security Views
Our views across the CLO equity senior securities are guided by three main criteria: portfolio composition, yield and asset coverage.
The following table illustrates the senior securities that we follow on the service and the relevant statistics. So far, our main focus has been on two securities:
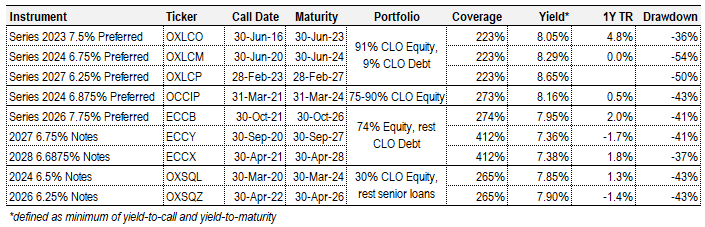
Source: Systematic Income
ECCY is attractive to us because of its strong asset coverage of above 400% and the company’s track record in buying back debt when the asset coverage of the baby bonds was reduced close to the regulatory guideline of 300%. Though ECCY and its sister bond do trade at the lowest yields across this set of securities, the yield give-up of about 0.80% on average is actually not that high for what is a superior asset coverage position.
OCCIP we continue to like for many of the reasons detailed in an earlier article. These include a move to conserve cash by the fund by delivering some distributions in stock, instituting a preferreds repurchase program, boasting a strong cash position and others. The stock has returned about 5% since then and consequently its yield has moved lower somewhat. However, its yield is still well above the OXLC preferreds while having higher coverage and above that of the ECC preferred that has similar coverage.
Another security that is on our radar is OXSQZ which boasts a 7.90% yield. This is one of two baby bonds issued by Oxford Square Capital Corp. which shares the same team as OXLC but is regulated as a BDC. The portfolio is composed about 1/3 of CLO equity tranches and the rest in senior loans about 40% of which is in first-lien and the rest in second-lien form. BDC baby bonds don’t have the same asset coverage requirement as funds which is why the bond’s coverage seems low at 265% as of the last report in June.
However, because its portfolio is majority in senior loans its profile is actually significantly stronger than even that of the ECC baby bonds. This is because in a serious drawdown, CLO equity tranches could very well go to zero given their embedded leverage of around 10x. Senior loans, however, have relatively high recoveries, though they are expected to move lower somewhat due to increasing covenant-lite issuance. First-lien loans have historically recovered around 77% which is expected to move lower to around 61%, according to Moody’s. That said, this recovery puts a natural floor on the realistic worst-case outcome for OXSQZ. This makes it the most robust security among this set in our view while offering a very competitive yield.
Takeaways
Allocating to CLO equity funds and senior securities is more difficult than for other types of income assets. The lack of NAV transparency makes it difficult to divine the discount valuation of common shares as well as asset coverage of senior securities. Our current highest-conviction pick in the sector are the Oxford Square Capital Corp. baby bonds (OXSQZ) which are backed with a majority senior loan portfolio at a decent asset coverage level. The baby bonds have a much more defensive posture than the other senior securities while offering a highly competitive yield.
Check out Systematic Income and explore our Income Portfolios, engineered with both yield and risk management considerations.
Use our powerful Interactive Investor Tools to navigate the closed-end fund, open-end fund, preferred and baby bond markets.
Read our Investor Guides: to CEFs, Preferreds and PIMCO CEFs.
Check us out on a no-risk basis – sign up for a 2-week free trial!

Disclosure: I am/we are long ECCY, OCCI, OCCIP. I wrote this article myself, and it expresses my own opinions. I am not receiving compensation for it (other than from Seeking Alpha). I have no business relationship with any company whose stock is mentioned in this article.
Additional disclosure: Also long OXSQZ
