Overview
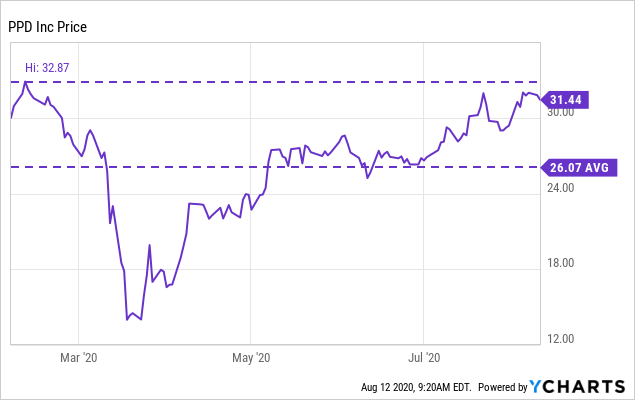
One of the leading providers of drug development services to the biopharmaceutical industry, PPD Inc. (NASDAQ:PPD), has beaten analyst estimates of revenue by $84.47 million after the Q2 exit. As such, PPD stock has shown support from investors and is now up 8.08% to $31.44 over the past month to date (at time of writing). This is pleasing following the company’s IPO completion on February 10th this year, at a price of $27/share. However, PPD missed the Street’s EPS estimates by $0.15 posting -$0.03 in EPS for the quarter, which raises uncertainty regarding future price direction coming out of 2021. With additional uncertainty stemming from the ongoing turbulence the coronavirus has placed on the company’s existing markets this year, visibility in cash flows and valuation are the key factors investors should lay weight to in the short to mid-term.
It’s early days for PPD within the public domain since the offering earlier this year and the entity’s holding company structure may present execution risks from its subsidiaries. We therefore advocate potential shareholders to play carefully and arm themselves with a process similar to our thinking, to effectively build in risk controls similar to ours for their investment case, in order to capture any asymmetry or upside in risk/reward, whilst managing downside risk within the foreseeable future.
Investment Thesis
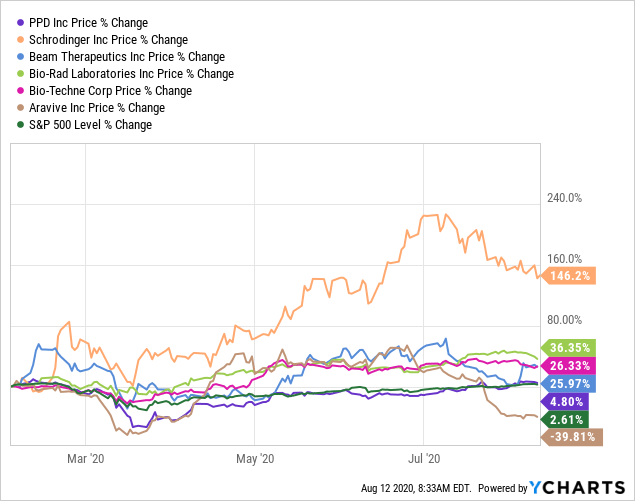
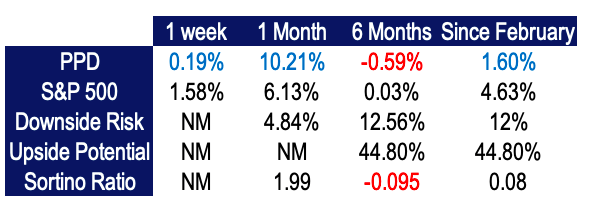
The company was not immune to the market effects suffered from the pandemic, although has shown support all the way back to the $31.44 level (at time of writing), just 4.54% off the high in February, resultant from a smooth uptrend since May. Whilst the company has beaten the S&P 500 (SP500) by only around 2.19% since this period, the price is down -0.59% over the six-month period to date and has shown smaller change in price relative to the 5 comparables used throughout this report.
 Data by YCharts
We feel the uptrend from May could have the legs to continue in the short-term on the back of the company’s posture on FCF and ROCE, alongside projections moving through the remainder of FY2020 and beyond. Our forward estimates over the coming periods are also partially drawn from empirical evidence that highlights the strong correlation between short-term price movements and earnings surprises. However, the current valuation and poor solvency coverage offsets our optimism on this sentiment. Thus, we are in no rush for an entry point until the company evidences ongoing competency in these domains.
 Data by YCharts
Data Source: ValueLine PPD; Author’s Calculations
We have scored ROA, FCF, return on capital employed alongside other measures to garner more oversight into the investment case, while examining potential risk from a historical downside potential and solvency perspective, to assign at landscape that we believe will guide potential and current shareholders to make the most informed decision on a long, short or hold strategy over the short to medium-term.
Profitability
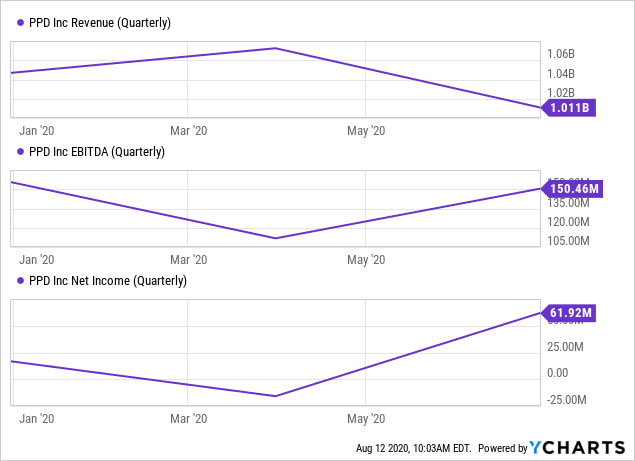
Gross revenues for the Q2 exit were $1.01 billion on a net income of $61.9 million. Margins on these two figures were 63.15% and an inferior 1.88%, respectively. Revenues have declined by -6.62% since the IPO in February, however have climbed 4.52% YoY at June 2020. OCF is at $445.8 million from the most recent report, expanding by 12% over the previous single-year period leading up to June. Margins on OCF are 10.7% for the TTM, which have remained stable YoY, increasing slightly from 10.32%. Gross revenues have climbed steadily at 1.6% over the past 6 quarters, and have expanded 10.69% over the previous 3-year period to date. Net income has fallen by over -73% across this same time period, however has shown a turnaround since June last year of 93.5%, up from $32 million a year ago, whilst EBITDA is grew 3.39% YoY. Expansion over net income was largely due to growth in the business operations, gains over return on capital employed and invested capital alongside redemption of unsecured notes within their subsidiaries. Additionally, during the six months ended June 30, the company recognized revenues of $709.5 million, from the balance of unearned revenue outstanding as of January 1, 2020.
 Data by YCharts
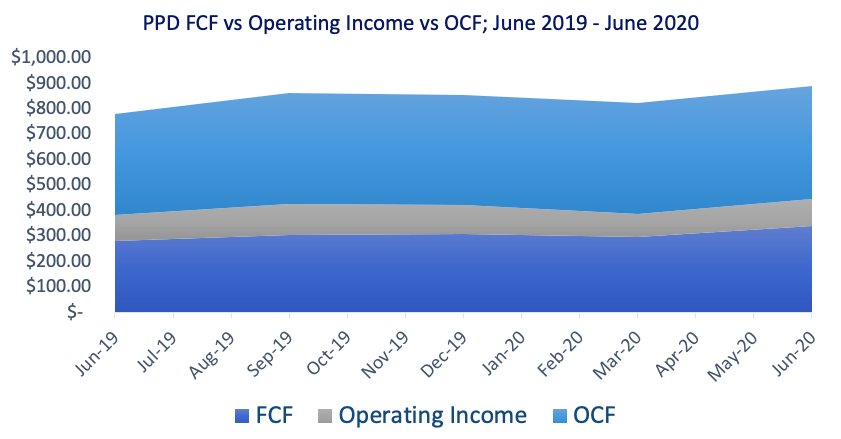
Although gross revenues have shown a steady decline this year, COGS have increased by 13.5% over the past 2-years to date, which the company attributes simply to rising manufacturing and R&D costs. On the contrary, whilst sales and earnings have been volatile, FCF for the company stands out to us here, remaining in the black since the IPO and throughout the pandemic.
Additionally, prior to February this year, free cash flow remained positive for the 3-years to date. FCF has climbed 45.54% YoY on a TTM figure of $339 million and represents 8.16% of turnover, a level we are satisfied with, particularly as we define PPD as a mid-cap Healthcare entity and look to see FCF over 5% of turnover for stocks within this sector, of this size. Alongside CAPEX growth of 27.23% and $445 million in cash from operations over the TTM, PPD’s performance has been sound on the Q2 exit.
NOTE: Click on image for larger view.
Data Source: ValueLine PPD; Author’s Graphic
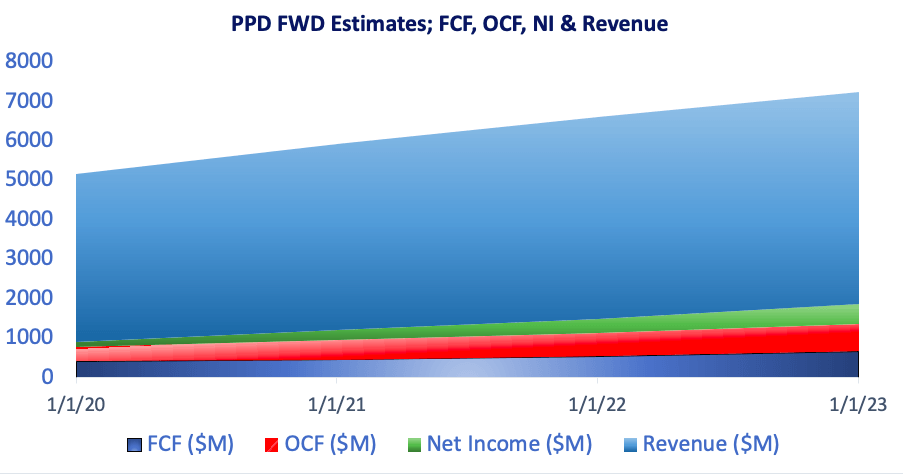
FCF is poised to climb at a CAGR of 13.8% reaching $656 million by 2023, whilst net income is estimated to expand at a CAGR of 40.66% over the same period; figures we have obtained by performing linear regression over the consensus of analyst estimates. Revenue is also expected to follow a similar trajectory and is tipped for $5.4 billion by 2023, a CAGR of 5.8% and increase of 29% from today’s TTM figures (obtained from the same method).
Data Source: ValueLine PPD; Author’s Calculations
Return on Capital
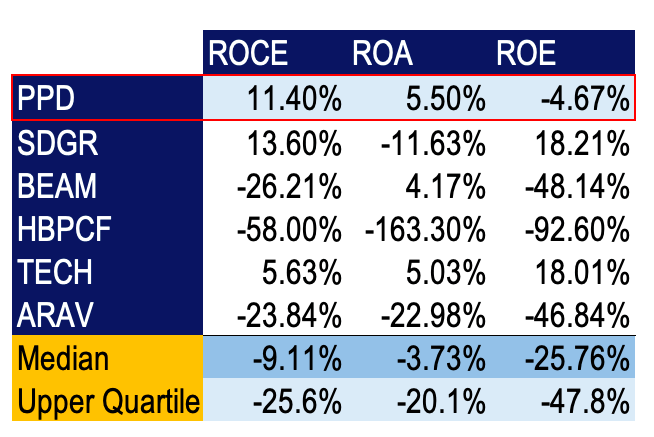
PPD has realized 11.4% return on capital employed this year which we are quite satisfied with, particularly with the backing of growing FCF and exiting the quarter strong on OCF. We will look to observe additional growth in ROCE as an indicator of growth in valuation. In light of COVID-19 related market turbulence, we are screening companies (in healthcare especially) who consistently evidence ROCE above 5-7% and have shown either growth or resistance to decline in this figure over the 1-3-year period to date. As we have little information on PPD’s ROCE metrics prior to February, that is one reason why we need the company to demonstrate ongoing capacity to maintain ROCE above these figures, preferably remaining above 10%. We also seek to align ROA with ROCE in companies similar to PPD’s story and look for ROA and ROCE to sit above 5% as a minimum.
Data Source: ValueLine PPD; Author’s Calculations
PPD scores a ROA of 5.5%, which is just aloft our minimum threshold, however is lower than the industry average of 6.4% although well ahead of the sector median of -28.48%. What is equally as pleasing to see is that PPD’s assets are turning over ~72 cents for every dollar invested into the asset base. We certainly value this as high, and with the high amount of leverage financing the asset base (seen below) the potential for additional growth over ROCE and ROA is feasible. We also see PPD outperforming the 5 comparables we have used for this analysis here, except for Bio-Techne Corporation (TECH) in ROE, where PPD has scored negatively as the company’s total liabilities exceed its assets on the balance sheet. Nonetheless, PPD has outscored Schrödinger (SDGR), Beam Therapeutics (BEAM), Helix BioPharma (OTC:HBPCF) and Aravive (ARAV) in all other metrics. In fact, each of the comparables have scored particularly poorly on this examination.
Solvency, Liquidity & Management of Leverage
PPD currently holds cash & cash equivalents plus marketable securities of $694.8 million, which is a wide enough cushion for the company in light of current operations. In regards to short-term solvency, here we start to see some cracks in the current position, with short-term coverage of 1.07x from liquid assets including cash. We look for a current ratio of greater than 1, preferably closer to 3x coverage in the healthcare domain, secondary to high fixed costs and ongoing R&D expenditure requirements. Interest expenses are marginally covered at 1.44x from the TTM EBIT total, which signals alarm bells for us, as we define adequate interest coverage as 3-6x the TTM interest expense at a minimum. So PPD has not performed to our expectations here. The company also has $1.99 in cash per share, quite low on our examination; compared to Globus Medical (GMED) for instance, who hold $3.34 on the same. Although FCF is eliciting growth and there has been evidence in price momentum of late whilst trading off its 52 week high, we look for a CF/Share value closer to $3+ alongside these figures, to fit with our postulated view on momentum into the future.
Additionally, the debt figure is at 117% of assets indicating that the company’s asset base is largely funded through its debt facilities. We tread with caution here, as the debt ratio figure is quite high for our liking, but may provide the company with the additional liquidity as needed, considering the return generated on the asset base and on capital employed. With growth in OCF and FCF, this may not be as big of a concern on face value, provided the company continues along the revenue trajectory as well. The debt/capitalization figure further illustrates the point here, sitting at 125%. We are therefore unsatisfied with PPD’s capacity to stay solvent in the event of large, one-off items that may impact the income statement in the near term.
Additionally, the company has access to a revolving credit facility of around $300 million. In March of this year the company drew down around $150 million from the facility for liquidity preservation and to strengthen their cash position, secondary to COVID-19. As of June, the company had repaid the outstanding balance from cash, which does offset the above points in terms of evidence in appropriate debt management. Building on this, the company also redeemed its outstanding notes for its wholly-owned subsidiary OpCo, settling the indenture of $1.16 billion in June, which had an uplifting impact on net income growth.
Also in June, two of the company’s other wholly-owned subsidiaries, Jaguar Holding Company, alongside PPD Development, issued a private placement of $1.2 billion in unsecured senior notes. The makeup was of $500 million in senior notes at a coupon of 4.625%; the other a $700 million placement principal on a coupon of 5%. The notes are set for maturity in 2025 and 2028, respectively. We also view the coupon in line with comparable notes on issue from peer entities. Therefore, the company has no meaningful debt maturities in the next 3 year time frame. However, investors should lay caution to the company’s capacity to repay obligations to primary claimants by observing FCF growth along the way. We want FCF to remain above 5% of revenues in order to accomplish this and reward shareholders, as well.
Valuation
Obtaining valuation scores for comparative analysis was difficult, secondary to the absence of profitability in several of the companies we compared. Moreover, we would tend to stay clear of investing into companies whom elicit significant lack of profitability that renders valuation difficult. Thus, from an opportunity cost perspective, we don’t feel there is a loss in our comparables earning a blank score from their performance. On that front, we can see the P/E figure of PPD to be exquisitely high, and thus are not certain this is a true reflection of market expectations for the company. A DuPont-style analysis will need to be conducted over the P/E figure to determine where the value is stemming from. We will complete this in house.
Furthermore, we see the market valuing the company on a P/Sales front below the sector median, and well below SDGR, BEAM & TECH. We have decided to score the Book/Market figure over the Price/Book metric in this case, to gain a deeper understanding of the value creation for shareholders from management from each peer entity. As PPD has a negative net asset value, we see the M/B figure as negative here, consequently we do not feel value has been created for shareholders above the book value of equity per share. All other comparables register high valuation on this front, by our estimation, particularly TECH on current trading of $263.50.
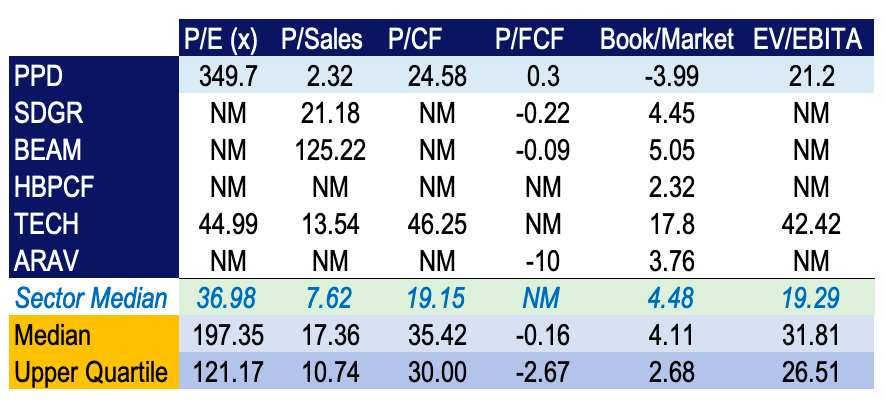
Data Source: Author’s Calculations
We also deem the P/FCF unsatisfactory as it sits below 1 which we would suggest is an indicator that the company has questionably ability to generate additional revenues above analyst estimates into the future. Therefore, on a ratio front, we feel the company is overvalued in respect to the market and to several of the comparables used.
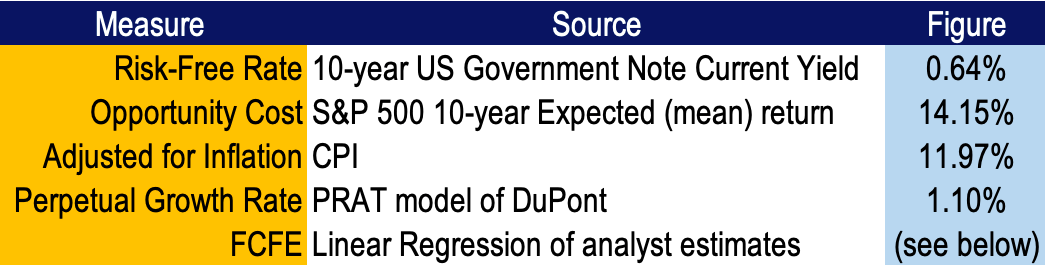
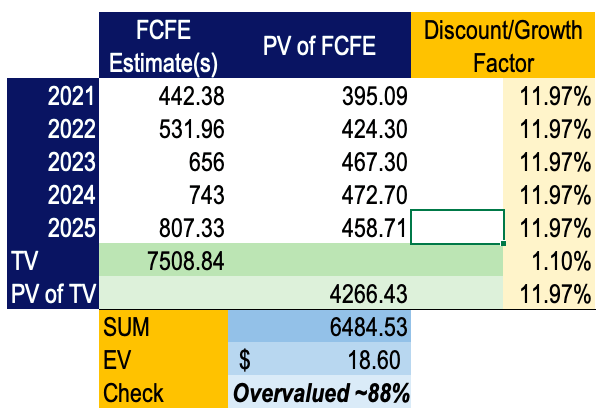
To add weight to our valuation model, we have examined FCFE using figures obtained from linear regression on the consensus of analyst estimates over FCFE. We are accustomed to assigning a sustainable growth rate using the PRAT model of DuPont to obtain our terminal value in year 5. To reduce forecasting risk, we have only estimated to 5 years out, which also factors in the highly disruptive and evolving nature of the Healthcare industry. Additionally, we have examined the opportunity cost of holding the S&P 500, using the 10-year expected (mean) return plus the risk-free rate as the proxy for our discount rate.
Data Source: Author’s Calculations
Doing so, we arrive at a fair value of $18.60, which we feel is reflective of market expectations and the company’s performance in the comparative analysis. We are firm in our belief that evidence of ongoing expansion in ROCE with FCF growth is ubiquitous with higher valuation in equities. Thus, we reiterate our point made above, in that we need to see further evidence of continued growth in ROCE and FCF to make an exciting entry point based on this valuation for PPD. Although at present these figures are satisfactory, it is the ongoing evidence we require.
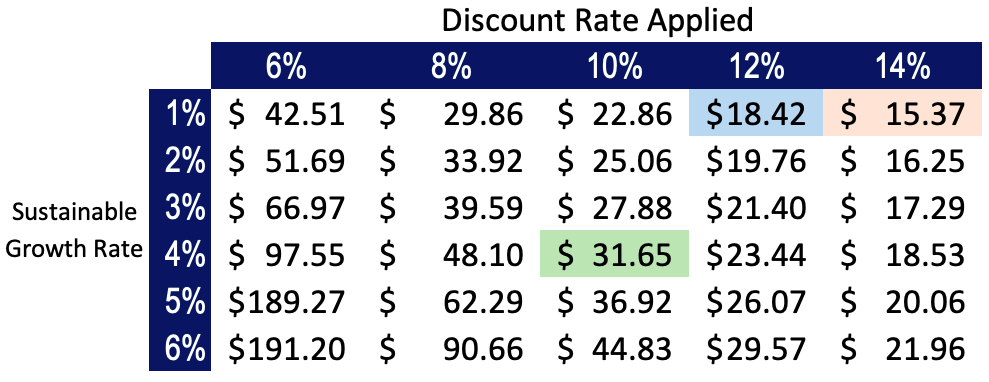
As is customary in our analyses, we have performed a sensitivity analysis on the inputs to our model to determine the range of fair values one would expect to see when using alternate perpetual growth rates and required rates of return below.
Data Source: Author’s Calculations
Based on our examination here, we confer with the overvalued status, as in all three of our scenarios, manipulating growth and discount factors, we see the stock as overvalued. Keeping it neat at 10% for the discount rate, we would need to see an exceptionally strong quarter from PPD to improve their PRAT score in the DuPont analysis, which we feel is feasible provided net margins increase from 1.88% to 8% minimum and management sort the leverage situation out, with reallocation of additional capital towards the asset base. Therefore, we set a price target of $44 from our most optimistic blue-sly scenario and $18.60 in the bear case, on the current entry of $31.44 (at time of writing)
Strategy
We are advocating against entry at the current price alongside the current situation over valuation. We need further evidence of continued growth in ROCE, net profit margin and FCF growth, to see the valuation climb to a respectable level and present an exciting entry point. On that basis, we are content in even waiting 3-6 months, with a plan to enter at our current protocol of 0.1-0.5% of NAV for new positions over the short to mid-term, provided the company comes though on ROCE, FCF and P/FCF within this time period. Should this occur, we would also hope to witness price momentum of 20-25% over the coming 1 to 3-month period, or ~$6.30-$8 a share, prior to entry. This would indicate enough fundamental and price momentum to commit to our strategy. We feel any sharp pullback from the current price would espouse the downside case, ending in a potential run down towards ~$18, or today’s fair value. Thus we would stay well clear in this event.
The two upside factors combined will allow us a reallocation scale up to the upside target price range of $44 if momentum were to continue, where we can reassess our hypothesis at that time. To manage downside risk, we intend to keep the original position small (as mentioned) which will allow additional leeway to retest and refine the hypothesis, whilst permit an easier exit point without any carnage. If we were to enter on the above parameters, we would look to capture any profits early and make a swift exit; even as early as 3-6 months if necessary. We would be anticipating for a spike of 30% on our holding in the upside case to indicate our success here. An immediate exit would occur where we see a drawdown of 15% in value from our entry position. We are also in talks for an options strategy within the risk control profile to acquire in the money puts; partially to offset the margin requirement for a short, but also to add a hedging layer to our strategy – but we are patient here also, to factor in the spread in strike prices on the potential outcomes on the investment outlay.
Further Considerations
The company claims to work alongside 50 of the largest Pharmaceutical clients within the globe, thus geographical strength is apparent for ongoing expansion. On that front, PPD is focused on bringing new medicines to the world, and let us not forget the company has been successfully doing so for over 30 years now, albeit making its public debut in February this year. Of the two reporting segments, namely, clinical development services and laboratory services, there seems to be an element of superiority in the way PPD achieves its mission. Teaming with some of the largest names in the game positions PPD aloft many competitors, particularly with the ongoing need for innovation and disruption within Bio-Pharma and Pharmaceuticals in general.
We keep touching on the need for the company to register ongoing competency in generating return on its capital employed and the investment of capital. We feel it is crucial to get demonstrate as it will get us excited to make an entry. To illustrate, gain on investments from March to June was $96.6 million, whilst ROCE was 11.4% using TTM figures. We like these figures, provided they are sustained into Q3. That is certainly interesting, because then we would have further evidence of the company’s ability to compete successfully in the public domain and illustrate a long case for investors. We are sure that the market will price those results in accordingly, over time. Let us also realize that the company has remained resilient throughout the COVID-19 pandemic, unlike many competitors. The business model and strategic partnerships undoubtedly play into our sentiments there, so investors should look for the company to maintain its stance here.
Conclusion
A strong Q2 exit is just not enough to get us completely sold on the company, not just yet. We have mentioned that ongoing evidence of the company’s ability to maintain high ROCE and return on invested capital is required to support and ultimately improve the valuation from current estimates. Provided the fundamental and price momentum converge and illustrate a picture of growth, we will be ready for an investment outlay of 0.1-0.5% NAV, ready to take profits early, but exit immediately on drawdown of 15% from that value. We don’t want to see a pullback in this story, we hope for continued growth so that the case is made for the bulls. PPD has remained resilient since the IPO in February, however we are happy to sit on the sidelines for now and are backing the company for a strong Q3 performance and to the remainder of 2020.
Disclosure: I/we have no positions in any stocks mentioned, and no plans to initiate any positions within the next 72 hours. I wrote this article myself, and it expresses my own opinions. I am not receiving compensation for it (other than from Seeking Alpha). I have no business relationship with any company whose stock is mentioned in this article.
Editor’s Note: This article covers one or more microcap stocks. Please be aware of the risks associated with these stocks.
