August 4, 2020 at 8:00 pm ET
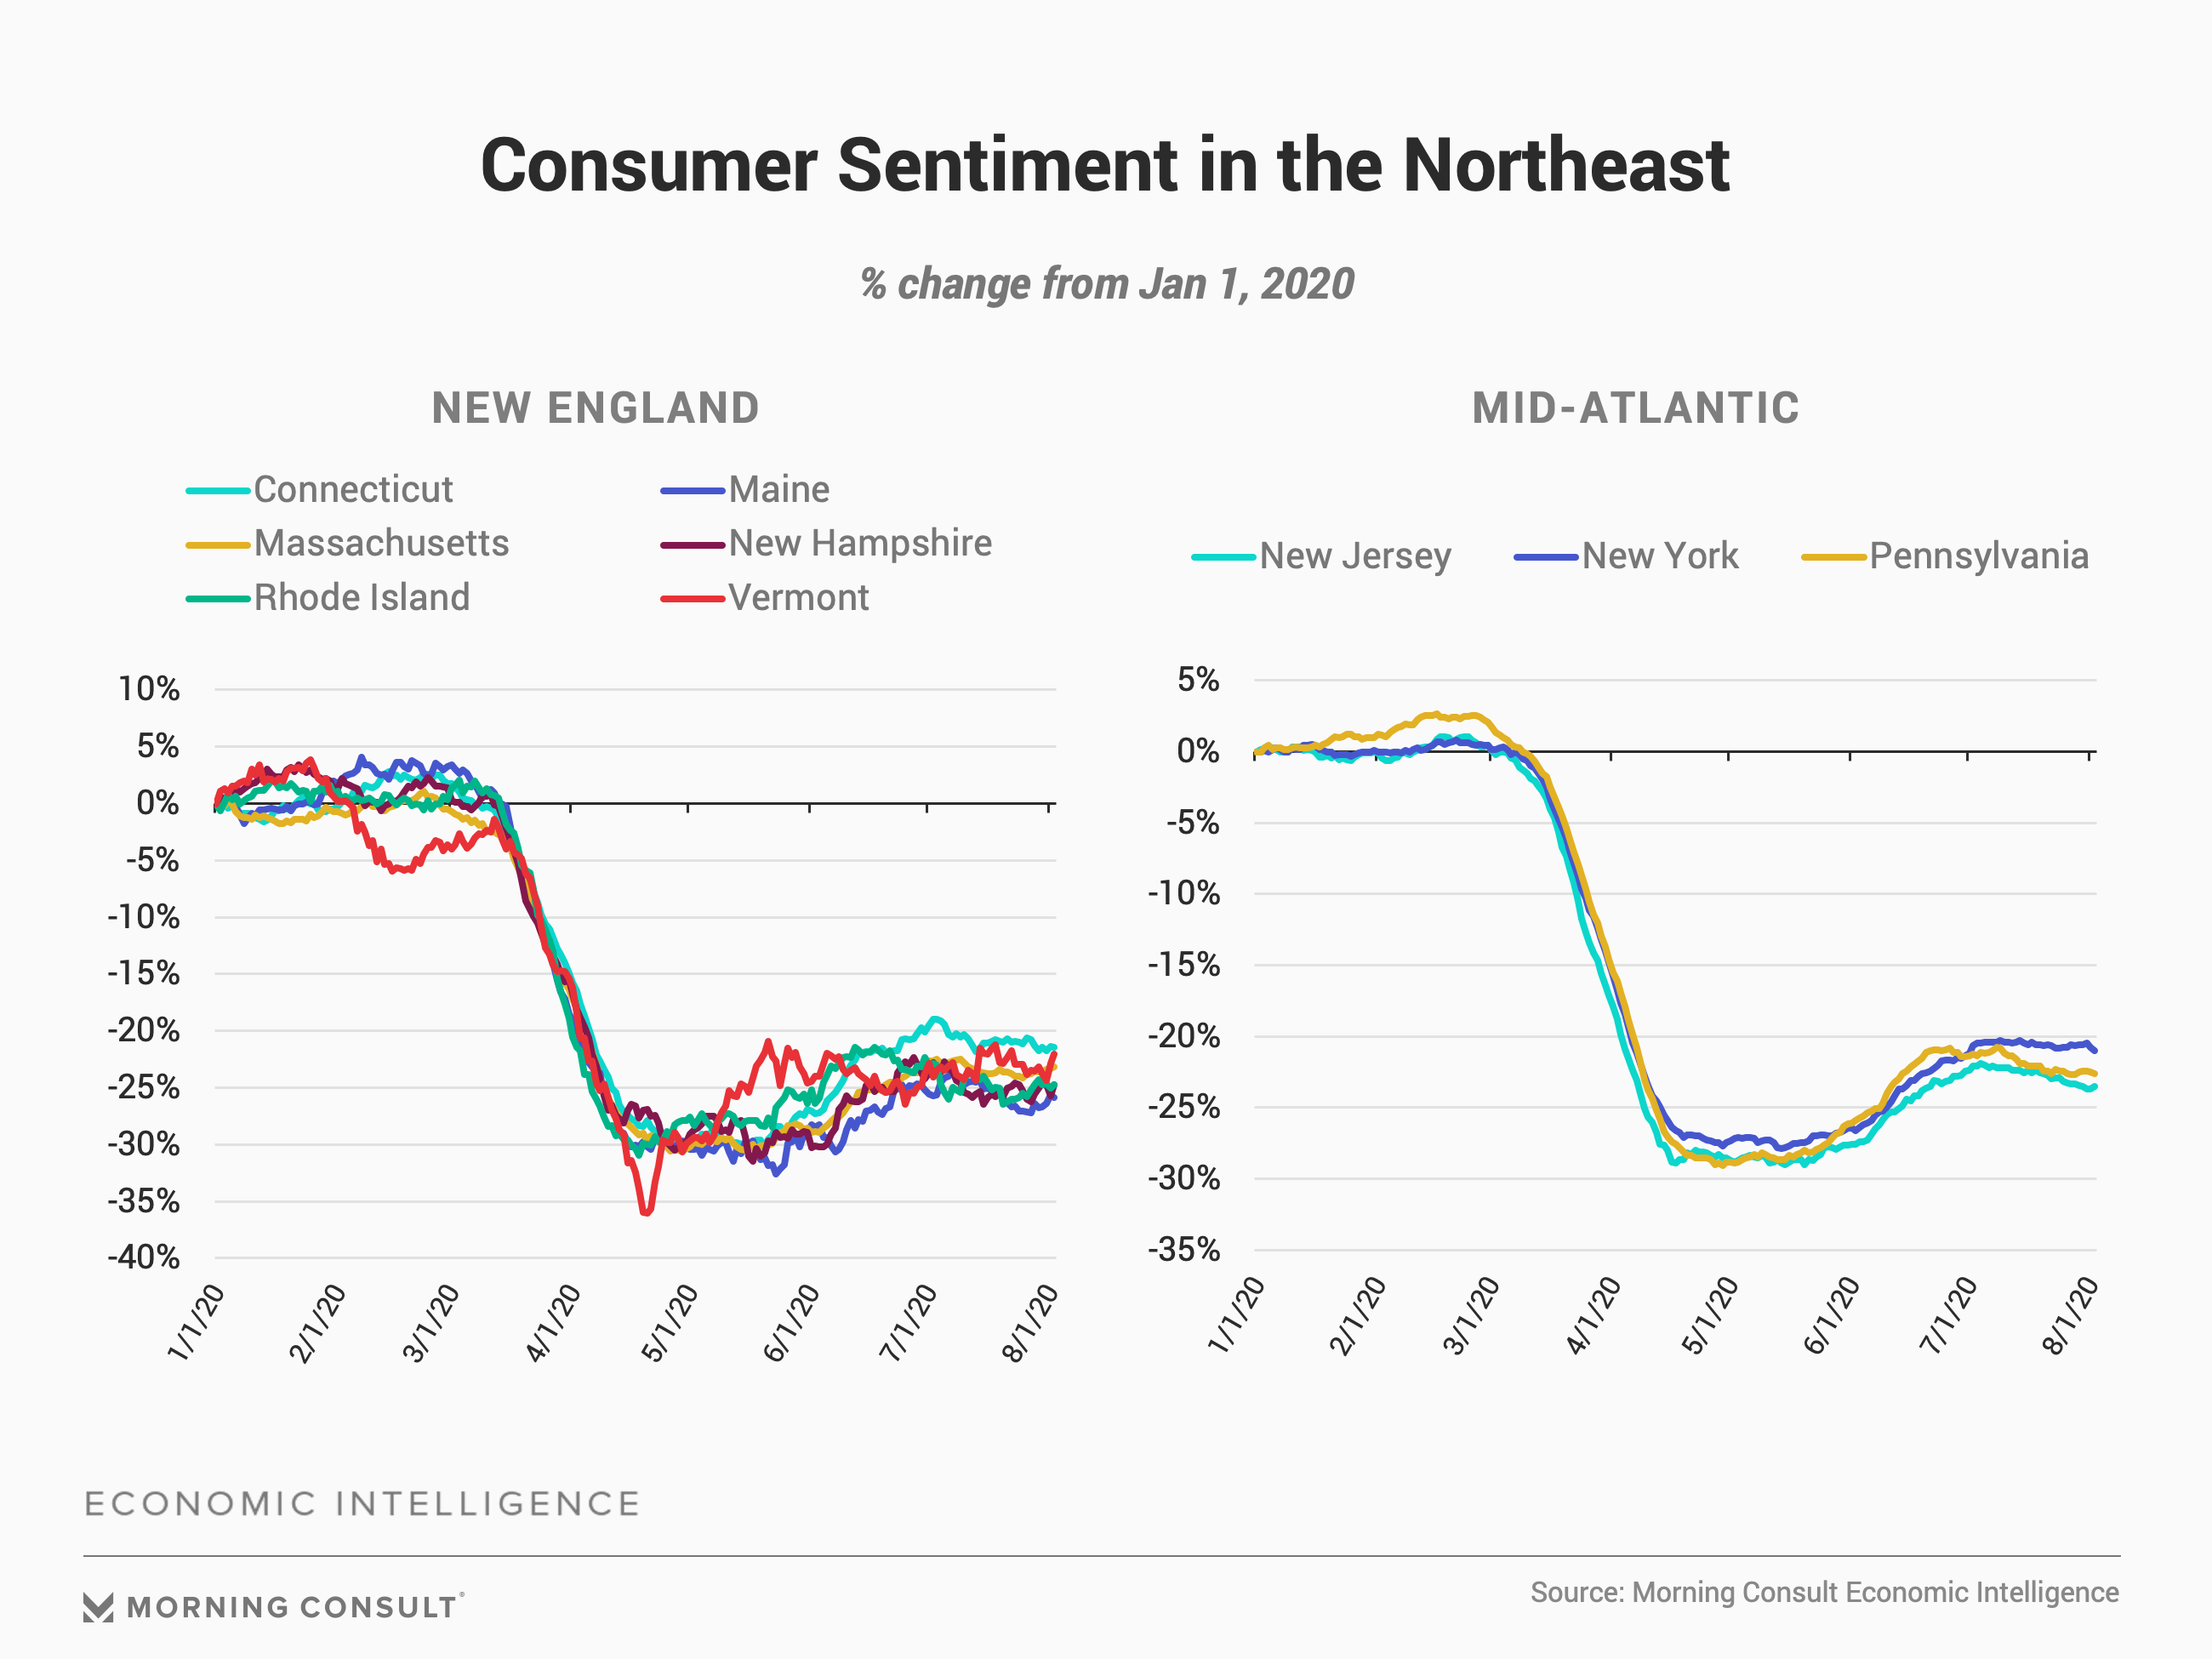
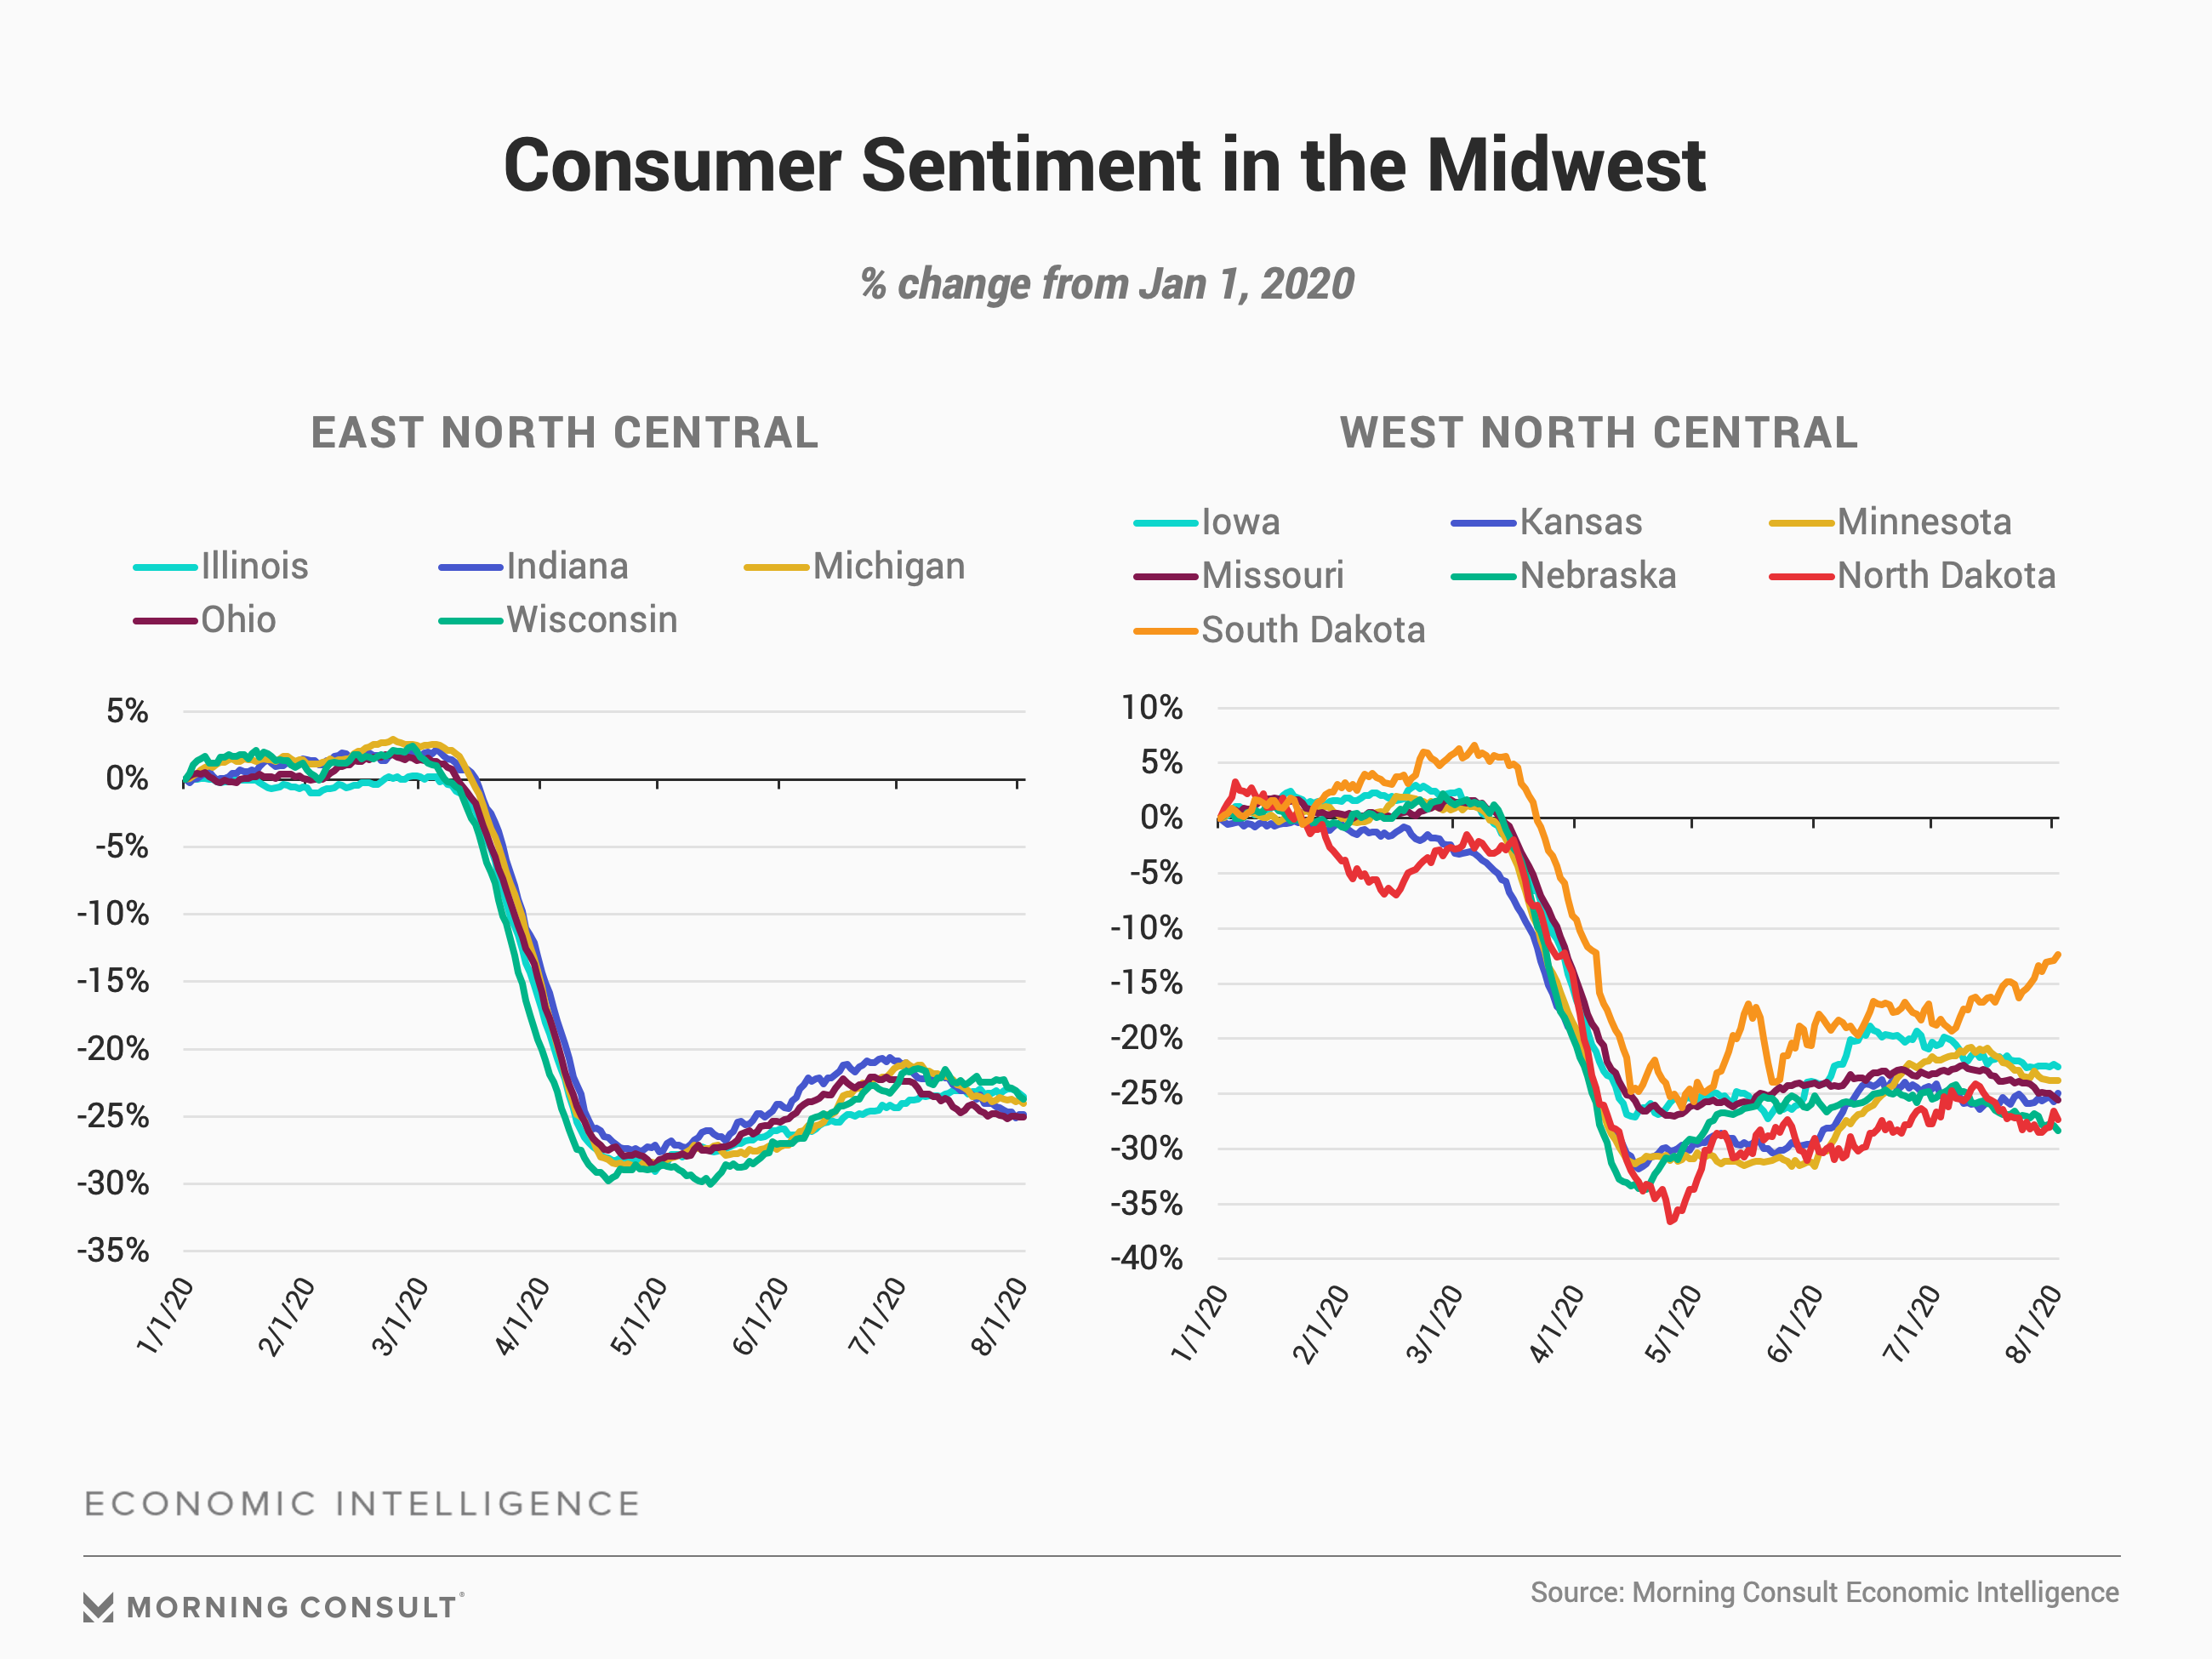
Since the onset of the coronavirus pandemic, consumer confidence has shifted dramatically in all 50 states. However, the precise magnitude and nature of those shifts varies in important ways, and those nuances carry vast implications for policymakers, businesses, and other leaders as they seek to understand the unfolding crisis and respond effectively. This report, based on Morning Consult Economic Intelligence data, tracks state-by-state consumer sentiment since the beginning of the year, and will be updated twice a month to reflect the latest data.
How we measure consumer confidence: Each day, Morning Consult surveys over 6,000 U.S. consumers on their views regarding current and future personal financial conditions and business conditions in the country as a whole. The results from those survey interviews are inputted into the Morning Consult Index of Consumer Sentiment (ICS), with higher numbers indicating higher consumer confidence. For context, the ICS at a national level was 85.99 as of August 1. A full methodology is available at the bottom of the page.
Heat Map: How Consumer Confidence Has Shifted
Use the slider to track how consumer confidence has shifted.
Takeaways From The Latest Data
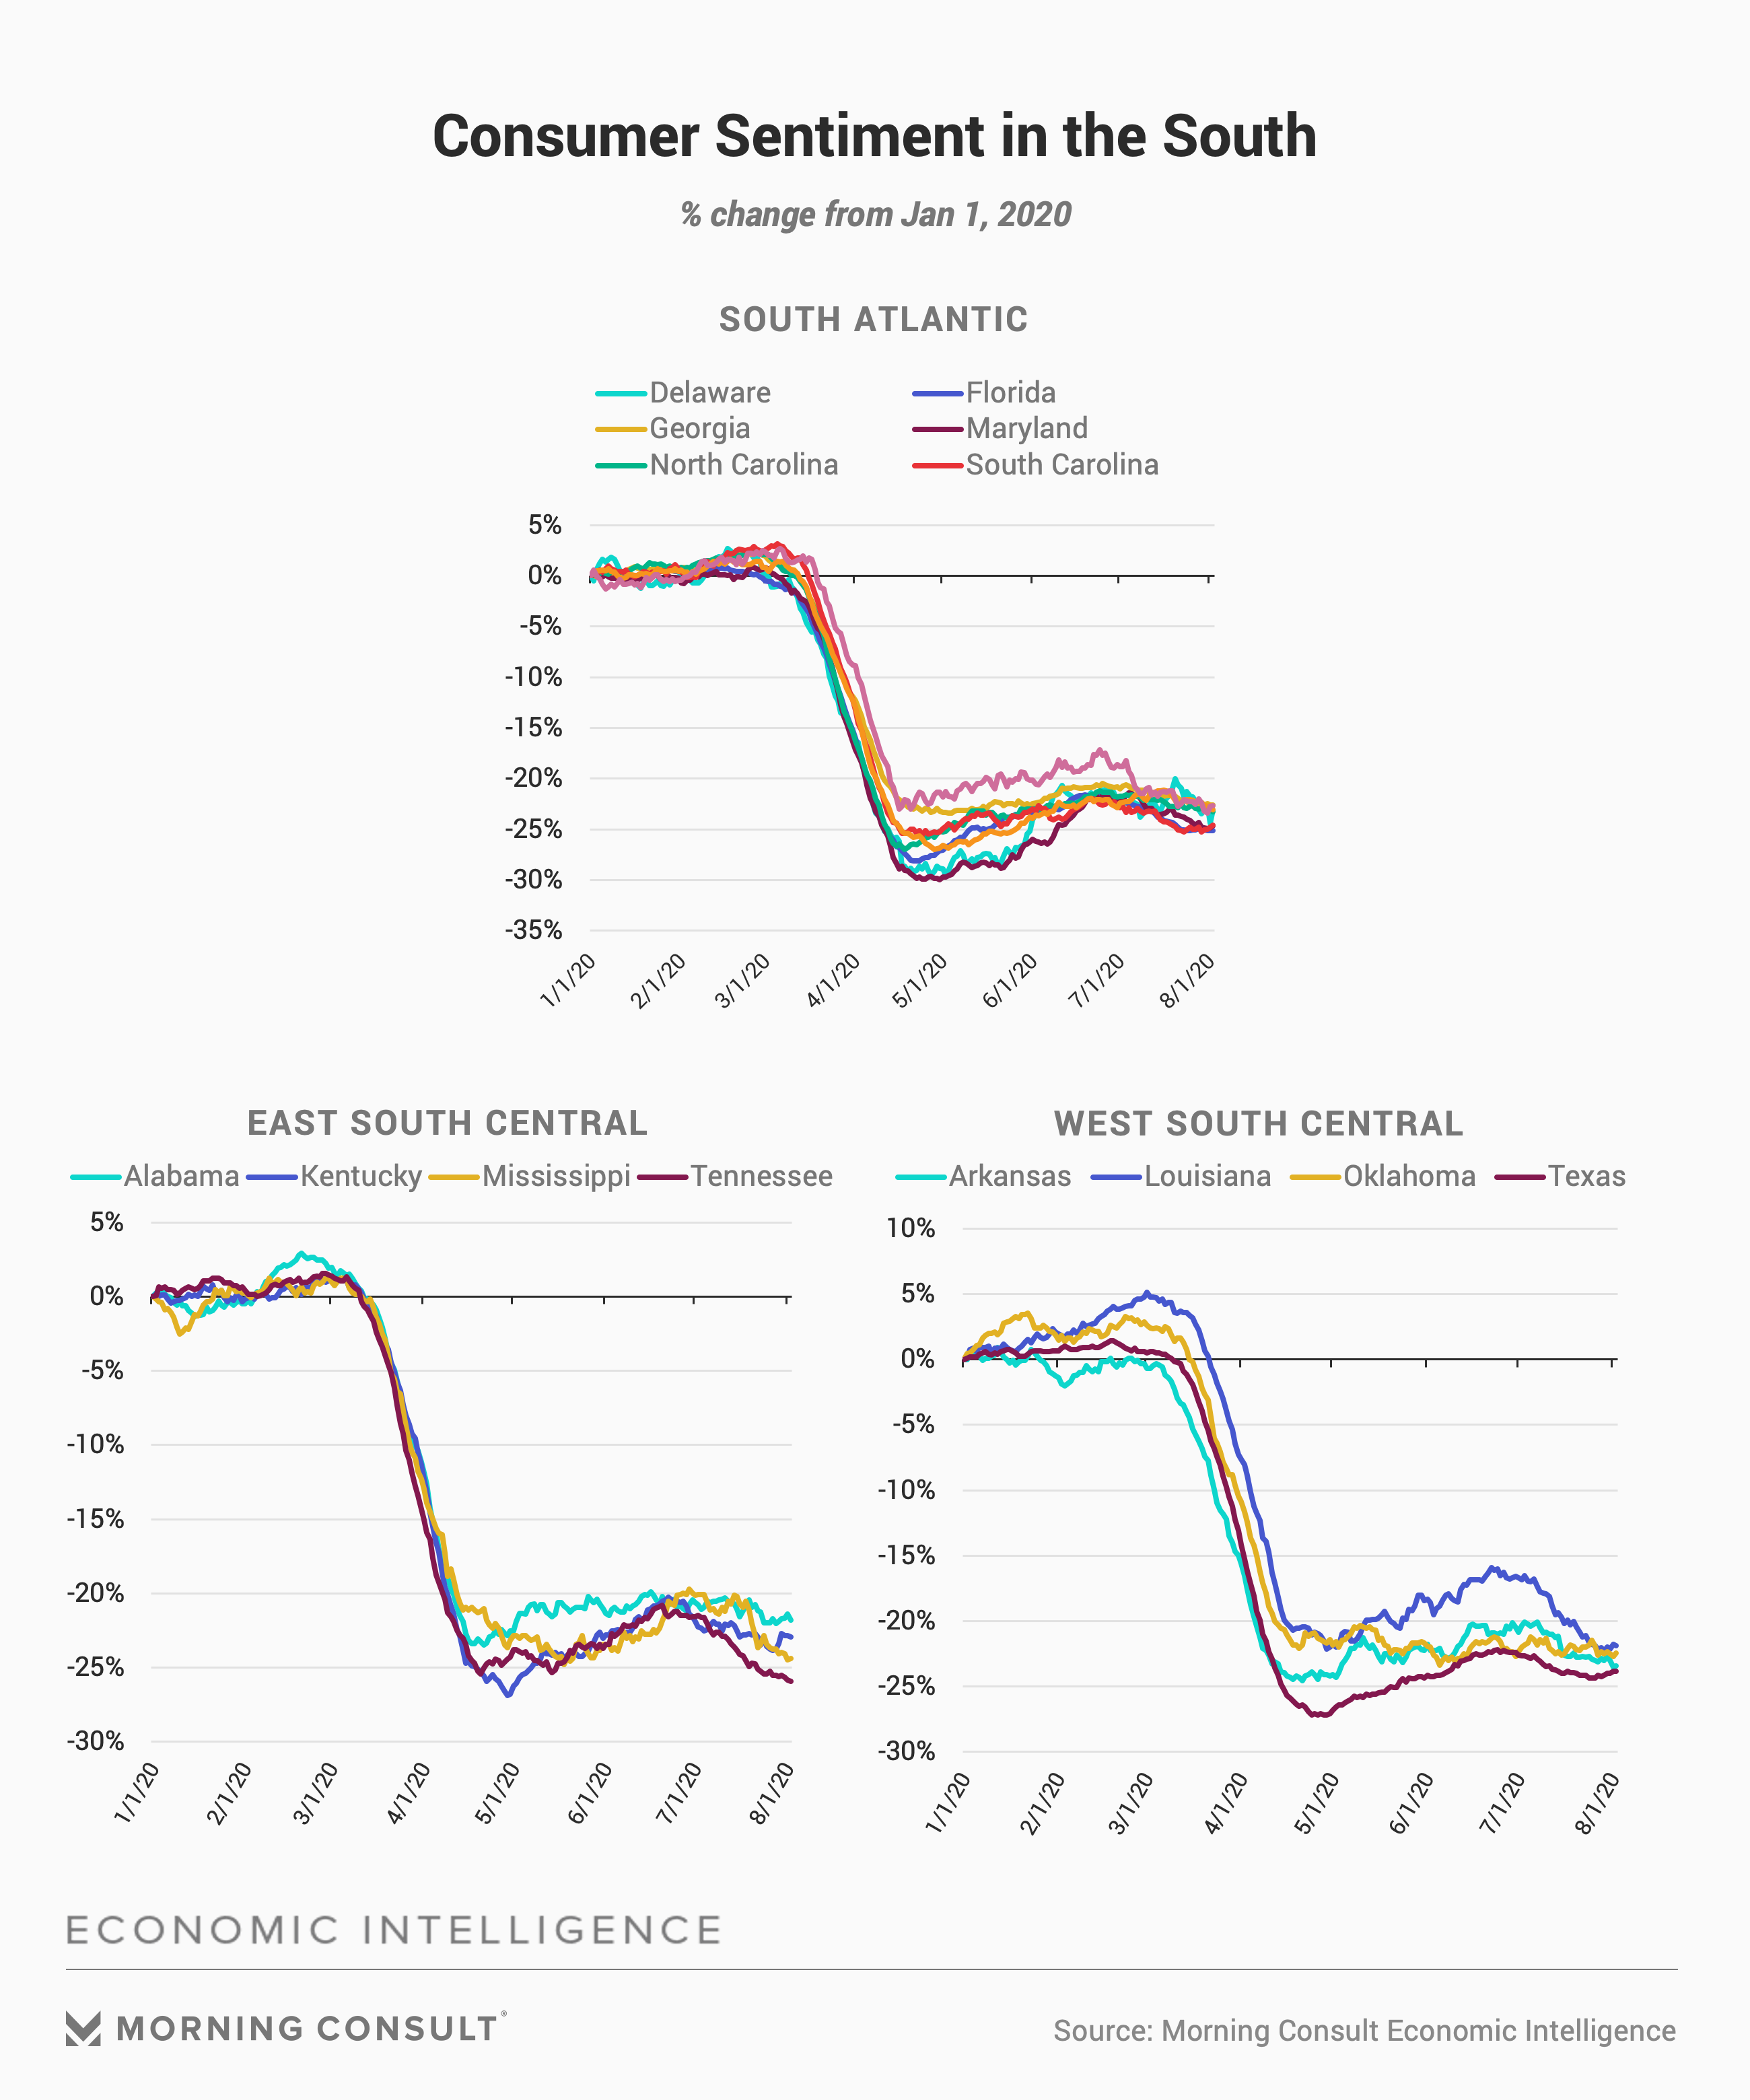
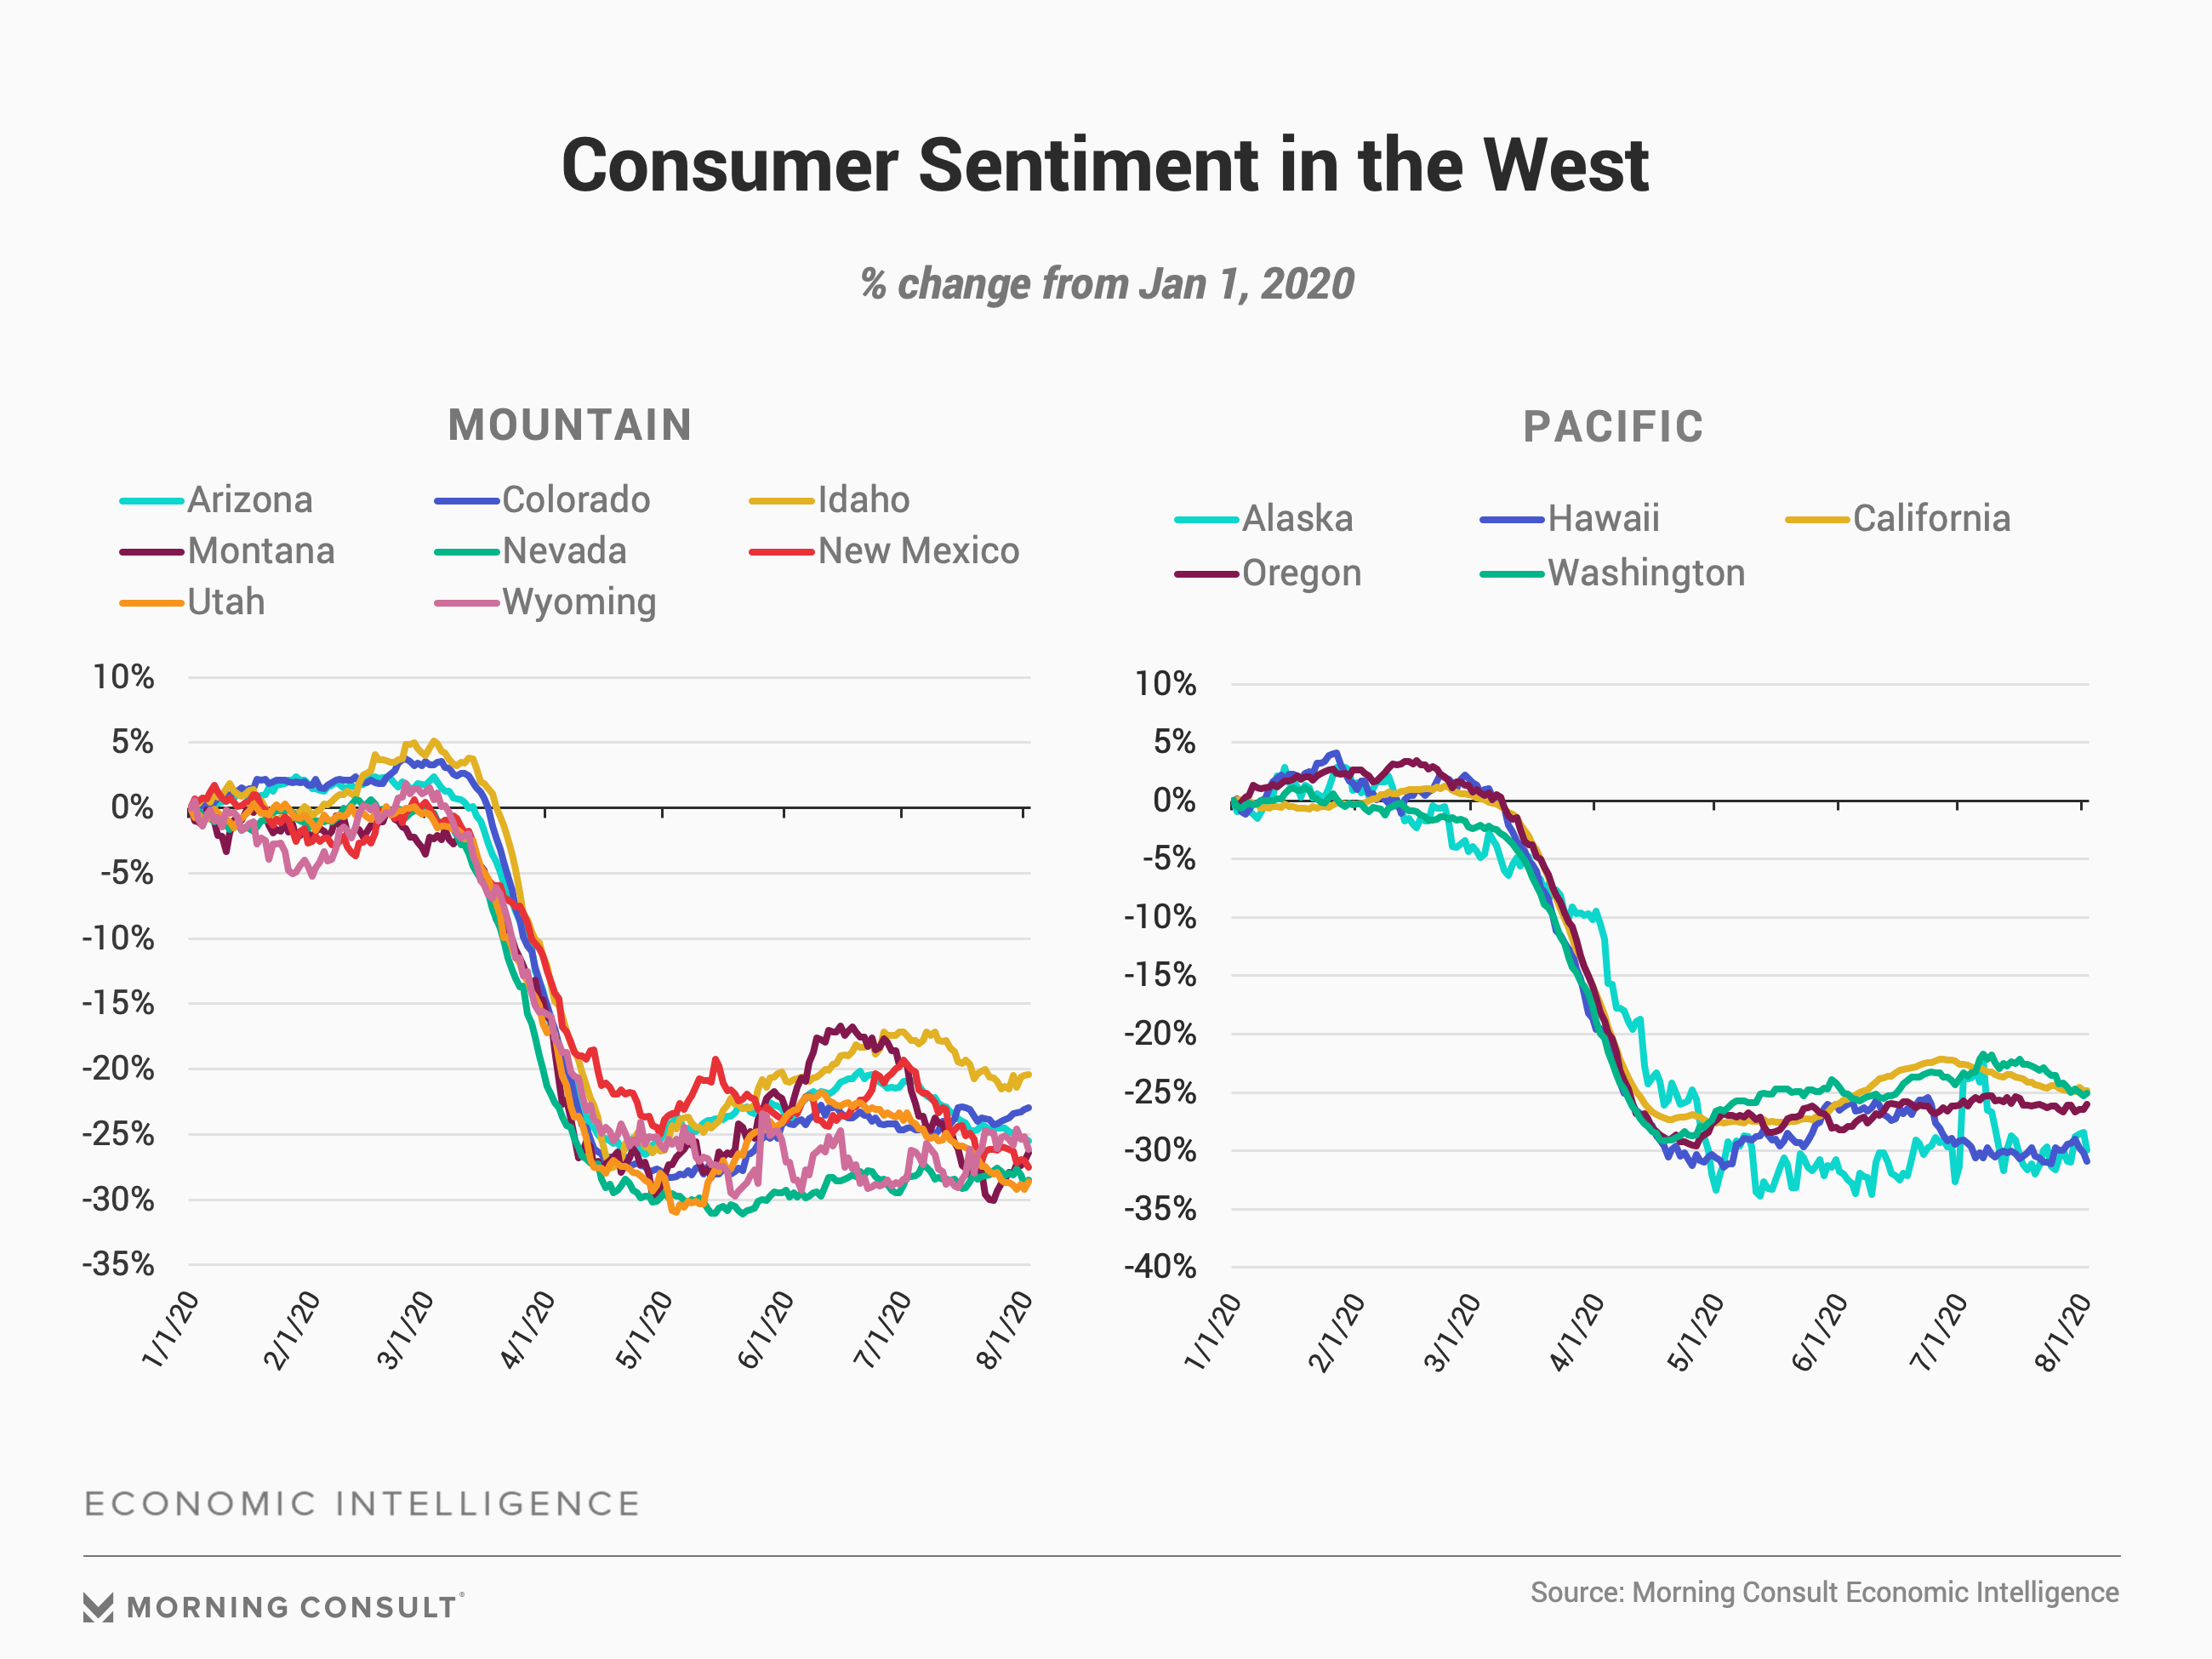
Consumers across the country grew less confident in the economy over the course of July, with the largest decreases coming primarily in the South and West.
Consumer confidence fell in 41 of the 50 states from July 1 through Aug. 1. The largest monthly declines occurred in the South and West, regions where the number of new daily coronavirus cases rose most in July. The Index of Consumer Sentiment in Florida, which has been one of the recent hotbeds for the virus, fell 3.7 points, the 11th largest decrease in July.
Consumers remain significantly less confident than they were when the year began. Since Jan. 1, 2020, prior to the onset of the pandemic in the United States, consumer confidence has fallen by 24.3 percent on average across the country, with Hawaii experiencing the largest decrease (30.9 percent) and South Dakota having the smallest decline (12.4 percent).
New Yorkers provide hope to other states.
New York was once the epicenter of the coronavirus pandemic in the United States, and confidence among state residents had fallen 27.4 percent relative to Jan. 1, placing New Yorkers 28th in terms of the largest decreases in confidence. Over the past three months, confidence has actually increased in New York so that it now has the third smallest decrease in confidence across the country. This rebound in confidence provides a path for other states struggling to reinvigorate their economies. States have to control the virus before they can expect consumer confidence to rebound.

| 1/1/20 | 7/1/20 | 8/1/20 | |
|---|---|---|---|
| Alabama | 125.5 | 99.7 | 98.7 |
| Alaska | 117.4 | 80.6 | 84 |
| Arizona | 116.5 | 92.1 | 87 |
| Arkansas | 118.6 | 93.9 | 90.7 |
| California | 111.1 | 86 | 83.5 |
| Colorado | 108.8 | 82 | 83.7 |
| Connecticut | 107.7 | 86.7 | 84.7 |
| Delaware | 115.5 | 89.4 | 87.3 |
| Florida | 119.1 | 92.9 | 89.2 |
| Georgia | 123.6 | 97.6 | 95.7 |
| Hawaii | 104.5 | 74 | 73 |
| Idaho | 119.5 | 99 | 95 |
| Illinois | 111.8 | 84.6 | 85.8 |
| Indiana | 117.9 | 93.3 | 88.6 |
| Iowa | 108.1 | 86.1 | 84 |
| Kansas | 116.3 | 87.7 | 86.4 |
| Kentucky | 115 | 89.8 | 88.7 |
| Louisiana | 119.3 | 99.4 | 93.3 |
| Maine | 107.6 | 80.1 | 80 |
| Maryland | 113 | 88.1 | 85 |
| Massachusetts | 108.4 | 83.9 | 83.2 |
| Michigan | 111.8 | 88 | 85.2 |
| Minnesota | 115 | 90.1 | 87.6 |
| Mississippi | 122.1 | 97.5 | 92.2 |
| Missouri | 119 | 91.4 | 88.9 |
| Montana | 119.3 | 96 | 87 |
| Nebraska | 117.9 | 87.8 | 85 |
| Nevada | 121.8 | 86.6 | 86.7 |
| New Hampshire | 109.3 | 83.4 | 81.2 |
| New Jersey | 111.7 | 86.7 | 85.2 |
| New Mexico | 114.4 | 92.3 | 83.5 |
| New York | 112.2 | 88.4 | 88.9 |
| North Carolina | 118.8 | 92.9 | 91.4 |
| North Dakota | 120.1 | 86.9 | 88.3 |
| Ohio | 114.9 | 89.3 | 86.1 |
| Oklahoma | 115.9 | 90 | 89.6 |
| Oregon | 106.5 | 78.7 | 78.3 |
| Pennsylvania | 112.8 | 88.7 | 87.4 |
| Rhode Island | 109.5 | 84.3 | 82.1 |
| South Carolina | 121 | 93.3 | 90.9 |
| South Dakota | 108.5 | 88.3 | 94.5 |
| Tennessee | 121.5 | 95.3 | 90.1 |
| Texas | 120 | 92.9 | 91.4 |
| Utah | 123.6 | 94 | 87.5 |
| Vermont | 99.4 | 76.6 | 76.6 |
| Virginia | 117.7 | 91.4 | 91.1 |
| Washington | 110.2 | 83.9 | 82.3 |
| West Virginia | 109.1 | 88.6 | 84.3 |
| Wisconsin | 110.5 | 85.6 | 84.6 |
| Wyoming | 122.7 | 87.8 | 91.8 |
Want to get daily access to this data? Contact us.
Methodology
Morning Consult Economic Intelligence: Global Consumer Confidence interviews more than 11,000 adults per day across twelve countries. In the United States, more than 6,000 daily interviews are conducted. The daily state-level data uses a 30-day rolling average and the data is weighted to age, gender, education, and race/ethnicity, along with marital status, population density, home ownership, a race by education interaction, and a gender by education interaction.
Survey respondents answer the following five questions:
1) Personal Finances – Current Conditions: We are interested in how people are getting along financially these days. Would you say that you (and your family living there) are better off or worse off financially than you were a year ago?
2) Personal Finances – 12-Month Expectations: Now looking ahead — do you think that a year from now you (and your family living there) will be better off financially, or worse off, or just about the same as now?
3) Business Conditions – 12-Month Expectations: Now turning to business conditions in the country as a whole — do you think that during the next twelve months we’ll have good times financially, or bad times, or what?
4) Business Conditions – 5-Year Expectations: Looking ahead, which would you say is more likely — that in the country as a whole we’ll have continuous good times during the next 5 years or so, or that we will have periods of widespread unemployment or depression, or what?
5) Current Buying Conditions: Thinking about the big things people buy for their homes — such as furniture, a refrigerator, stove, television, and things like that. Generally speaking, do you think now is a good or bad time for people to buy major household items?
The Index of Consumer Sentiment (ICS) is a simple average of the net scores of the five individual questions. For a given question, the net score equals the percentage of weighted positive values minus the percentage of weighted negative values plus 100.