
- The trajectory remained bullish on the daily chart, although bears are currently showing strong interest.
- The price dropped after marking a new yearly high around $0.0107 on June 4.
- VeChain lost 9% today after rolling back under 100 SAT.
VET/USD: VeChain Signals Short-Term Sell
Key Resistance Levels: $0.01, $0.0107, $0.01167
Key Support Levels: $0.0087, $0.0075, $0.0064
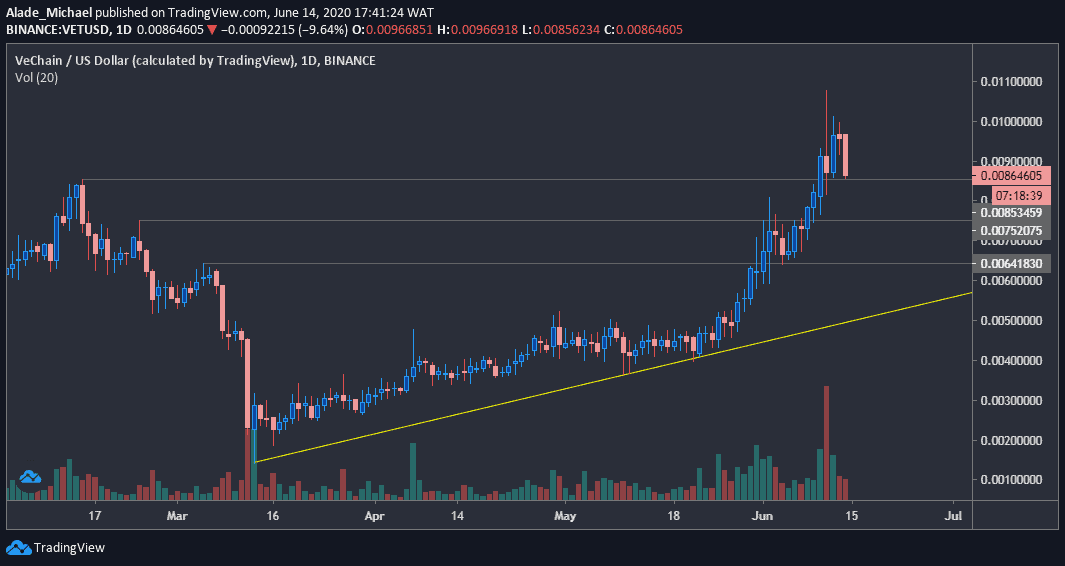
VeChain remains bullish on mid-term perspective despite dropping slightly from a $0.0107 on June 11. But the evening star (pin bar) close on that day suggests a short-term reversal, which is gradually taking place on the daily chart.
The price is now facing $0.0087 support (February’s high). The volume on the current daily candle shows that bears are slowly stepping into the market. Today’s drops are also an indication that the bears are here.
VET is trading around $0.0087 at the moment. A daily close below this support should introduce strong corrections for this pair. However, the yellow trend line could serve as support if the selling lasts long.
VET Price Analysis
If the price dips below $0.0087, the first support to consider is $0.0075. If the VET/USD pair fails to bounce from here, the primary support to look out for is $0.0064 – marked grey on the price chart.
On the flipside, VeChain could revisit the $0.01 level if the $0.0087 continues to hold as support. A further push may allow the bulls to reclaim the $0.0107. A successful climb above this price should send VET straight to June 2019’s high of $0.01167.
VET/BTC: VeChain Rolls Back Beneath 100 SAT
Key Resistance Levels: 93 SAT, 100 SAT, 108 SAT
Key Support Levels: 88 SAT, 80 SAT, 68 SAT
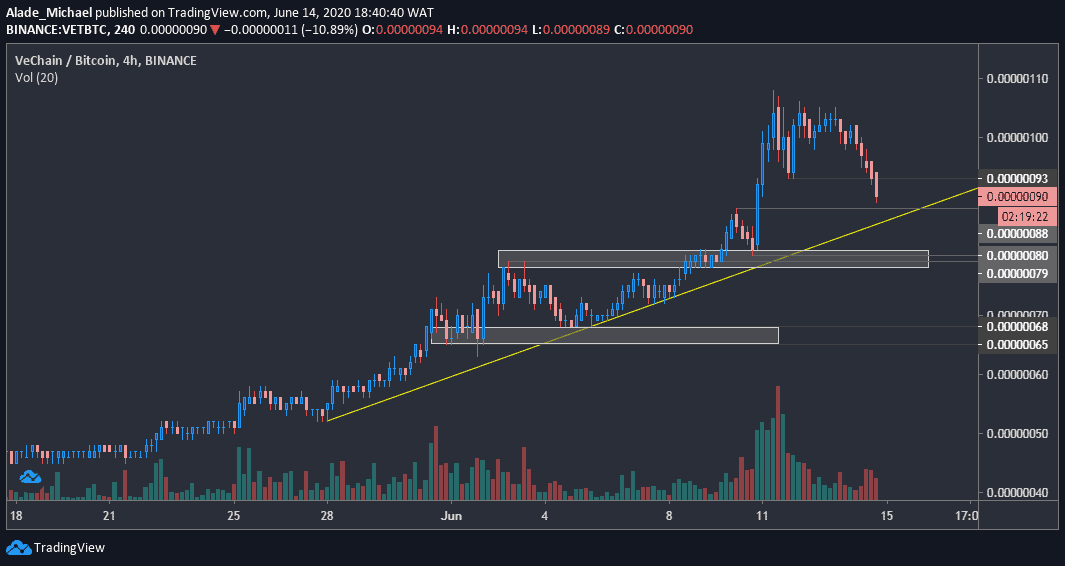
Against Bitcoin, VeChain just dropped below 93 SAT – a level that was suppressing bearish actions for the past three days. The current candle has now wicked the price near the yellow diagonal support forming for the last two weeks. Looking at the market structure, the selling pressure is now becoming noticeable on the 4-hours chart, with a 9.15% decrease over the last 24-hours.
The VET/BTC pair is currently losing momentum on the lower time frame. Despite that, the bullish parabolic move is still valid on the daily chart. But if the price drops below the yellow line formed on the current 4-hours chart above, it would signal a green light for a short sell.
VeChain Price Analysis
VeChain is approaching support at the 88 SAT level. Right below this support lies 80 SAT, which is found inside the first grey area. The price may further roll to the second grey area of 65 – 68 SAT in case of a breakdown.
If the price can recover above the 93 SAT level that was breached a few hours ago, the next swing high would target 100 SAT. It can even go further to the 108 SAT resistance level if it continues to gain momentum. A new rally may start once this resistance breaks.
Click here to start trading on BitMEX and receive 10% discount on fees for 6 months.
Disclaimer: Information found on CryptoPotato is those of writers quoted. It does not represent the opinions of CryptoPotato on whether to buy, sell, or hold any investments. You are advised to conduct your own research before making any investment decisions. Use provided information at your own risk. See Disclaimer for more information.
Cryptocurrency charts by TradingView.