
EOS Price Analysis – April 4
The EOS price was seen touching the $2.4 level on the daily chart as the coin is trading between the $2.26 and $2.43 levels.
EOS/USD Market
Key Levels:
Resistance levels: $3.0, $3.2, $3.4
Support levels: $1.7, $1.5, $1.3
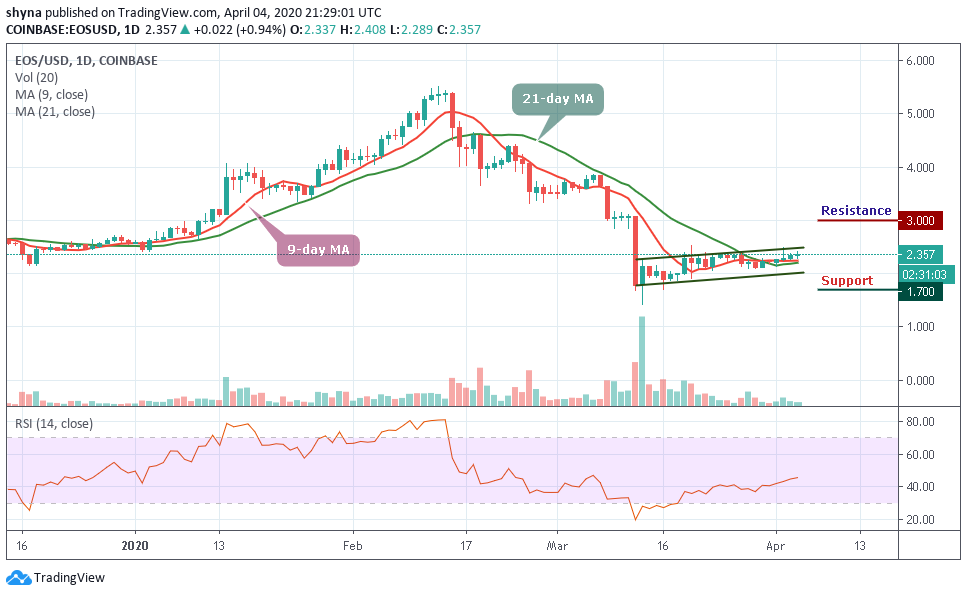
Looking at the daily chart, we can easily see that EOS/USD is changing trend slowly on the long-term outlook. The cryptocurrency was range-bound within the resistance level of $2.11 and the $2.43 price level for some time now. The bears may likely break down the former support level of $1.9 at a slow rate, and currently consolidating at $2.35 level.
More so, the trading volume is becoming low and should the bear push the price downward; the price could reach the support levels at $1.7, $1.5 and $1.3. In other words, if the price continues to move above the 9-day and 21-day moving averages, the price could hit the resistance levels of $3.0, $3.2 and $3.4 respectively.
The RSI (14) moves to test 45-level, which may give more bullish signals in the market soon.
EOS/BTC Market
When compared with Bitcoin, the EOS price is seen moving below the 9-day and 21-day moving averages but with a bearish candle. The RSI (14) is moving the 40-level which could still bring more bearish signals into the market. A possible drop may surface and the support levels to watch are 310 SAT and 290 SAT.
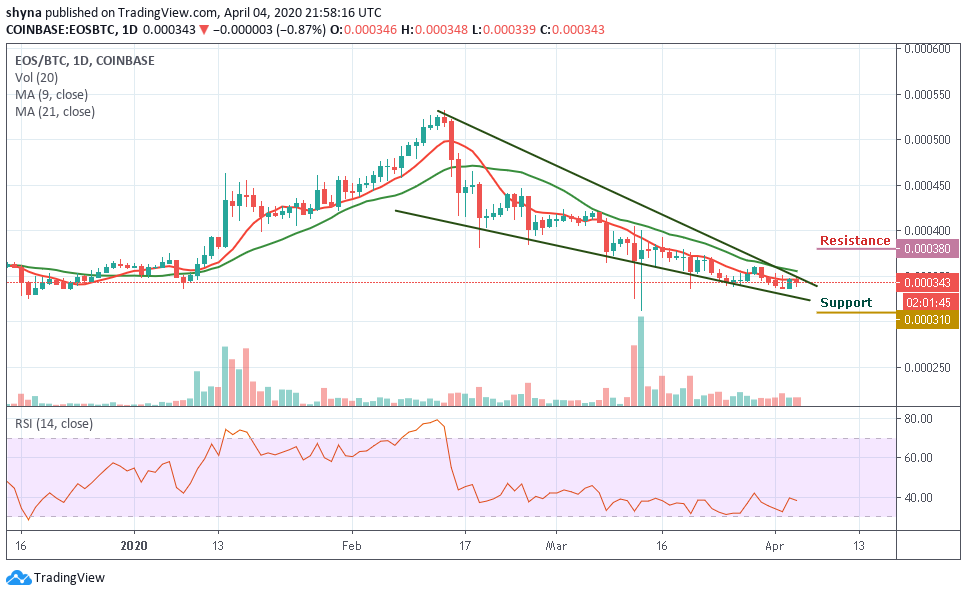
However, any form of a rebound from the above-mentioned supports could push the EOS price to the resistance level of 380 SAT and above. But the buyers may have to gather enough momentum to be able to push the price to cross above the channel.
Please note: Cryptovibes.com is not a financial advisor. Do your research before investing your funds in any financial asset or presented product or event. We are not responsible for your investing results.
