
Tron (TRX) Price Analysis – March 29
The price of Tron is yet to display a significant bullish move as the market continues to move in sideways within the channel.
TRX/USD Market
Key Levels:
Resistance levels: $0.014, $0.016, 0.018
Support levels: $0.008, $0.006, $0.004
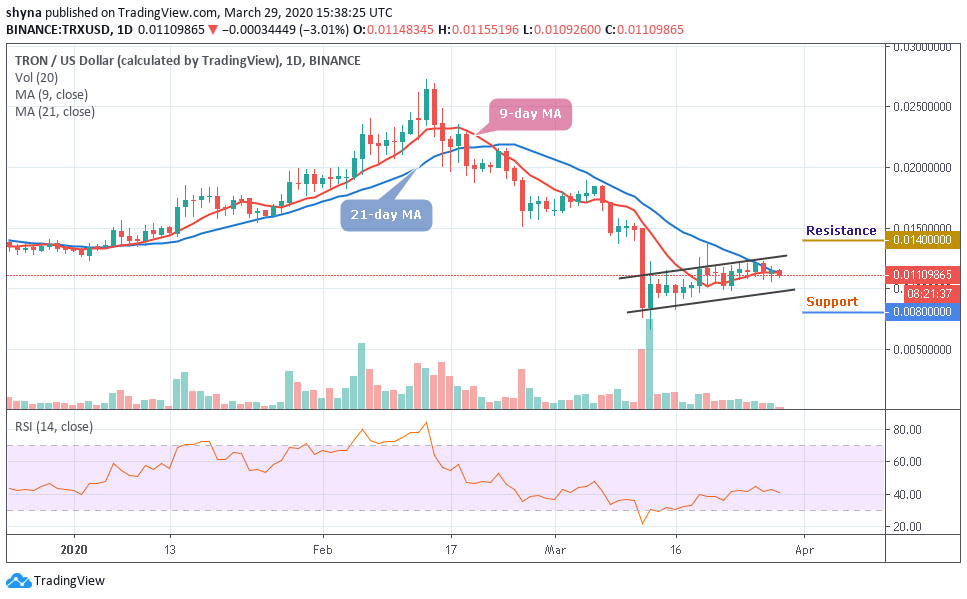
TRX/USD remained indifferent to the news. Since a couple of days ago, the price has fallen from $0.012 to $0.010. The daily price is about to cross below 9-day and 21-day moving averages as the trading volume decreases. Meanwhile, TRX/USD remains in an unstable market while a price surge is more likely to play out.
However, for an upsurge, the Tron price is likely to meet the nearest resistances at $0.014, $0.016, and $0.018 before we can still consider more levels for the trade. A down surge, however, could plummet the market to $0.008, $0.006 and $0.004 supports after a possible break at $0.010. The RSI has maintained trading in sideways and moving above the 40-level, showing an indecisive movement.
TRX/BTC Market
Comparing with BTC, Tron (TRX) is still trading on the downside as the bulls are making an effort to step back into the market. But Tron price may likely see another sharp drop at 175 SAT support level if it moves below the 9-day moving average. Breaking this level could further push the market to the nearest support levels at 160 SAT and below.
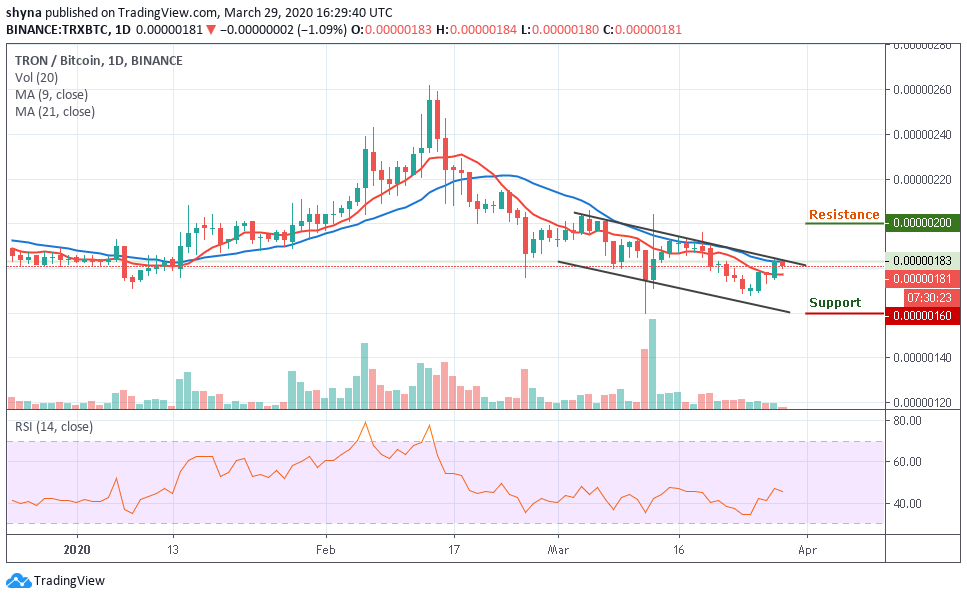
However, TRX is currently changing hands at 181 SAT and if the bulls can hold the price tight as it is, the next key target resistance lies at 200 SAT and 210 SAT respectively. Reaching these levels may likely move the market to another resistance level of 220 SAT. Meanwhile, RSI (14) is moving around level 45 and may likely give more bearish signals soon.
Please note: Cryptovibes.com is not a financial advisor. Do your research before investing your funds in any financial asset or presented product or event. We are not responsible for your investing results.
