
Litecoin is divided in the altcoin market-space. While coins above, like Chainlink and Cardano, are surging beyond expectations, others like Bitcoin Cash and XRP are going through slumps. On the other hand, digital silver is just hanging in there. Now on the 10th spot in the market, with a market capitalization of $2.7 billion, Litecoin is inching out of the top-10, with Crypto.com sniffing at its heels.
The short-term chart for Litecoin is more of the same, as the price continues to move as it has been since the beginning of June. In the first two weeks of July, Litecoin mounted an inverted head and shoulders pattern, dropping below $40, for the first time since after Bitcoin’s halving, and jumping back up over $45, followed by a drop once again.
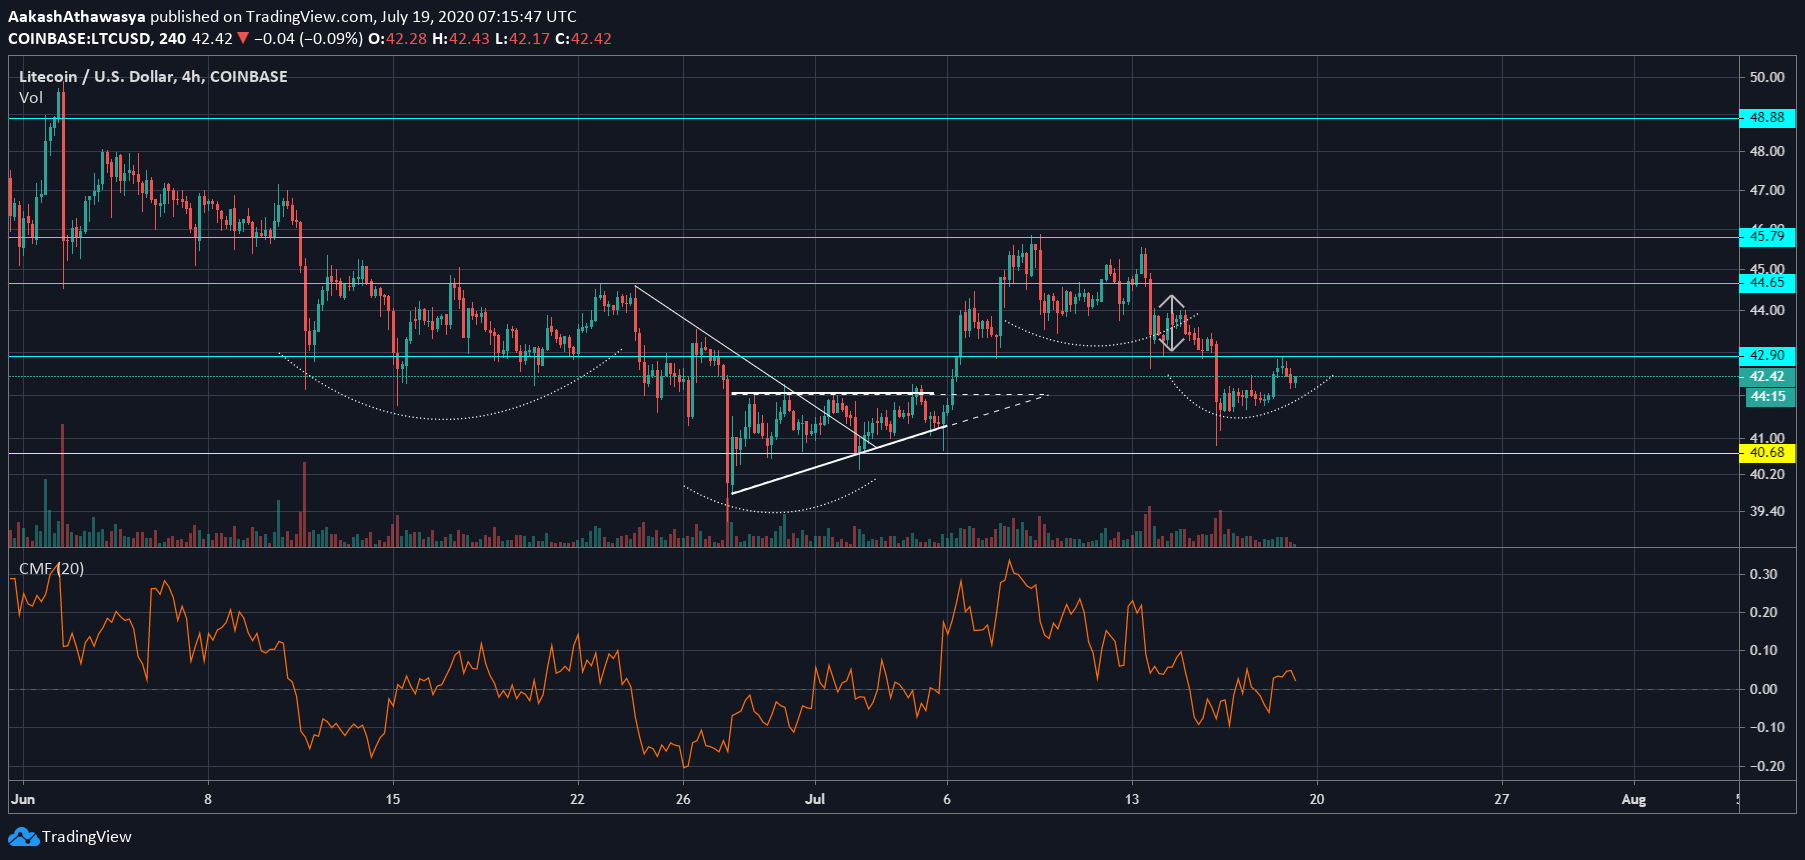
Source: LTCUSD via Trading View
As can be seen in the chart, the first shoulder ranged from 10 to 24 June, followed by the drop below the support level at $40,68 at the end of the previous month. The price then rebounded quite sharply breaking two resistance levels at $42.9 and $45.7, faltering at the third, placed at $45.79. The left shoulder persisted from the beginning of the month to the 12th, but eventually gave way on 13th, as the price dropped below the two resistance levels.
Chaikin Money Flow indicator for Litecoin’s 4-hour chart is currently at 0.02, marginally positive, after falling from a high of 0.3 on July 10. Since the price jumped from $41.5 to its press time price of $42.41, the CMF moved from -0.1 to +0.02 in the past few days. However, there is a disparity between the 24-hour volume during last week’s drop and the recovery. The former was $1.9 billion and the latter is currently at $1.16 billion, according to Coinmarketcap.
Given the severity and the swiftness of the aforementioned pump, there was an inevitable drop below resistance $42.9, but the price managed to hold strong over $41.55. Looking down, the next support level lies at $40.68, which is unlikely to be threatened, until the current curve is breached. On the way up, resistance lies at $42.9, and if passed LTC is likely to trade within the range of $42.9 to $44.65.
