
XLM Price Analysis – December 26
The XLM/USD is still within the limits of a bearish flag structure because the price is trading in the minor negative territory.
XLM/USD Market
Key Levels:
Resistance levels: $0.050, $0.52, $0.054
Support levels: $0.039, $0.037, $0.035
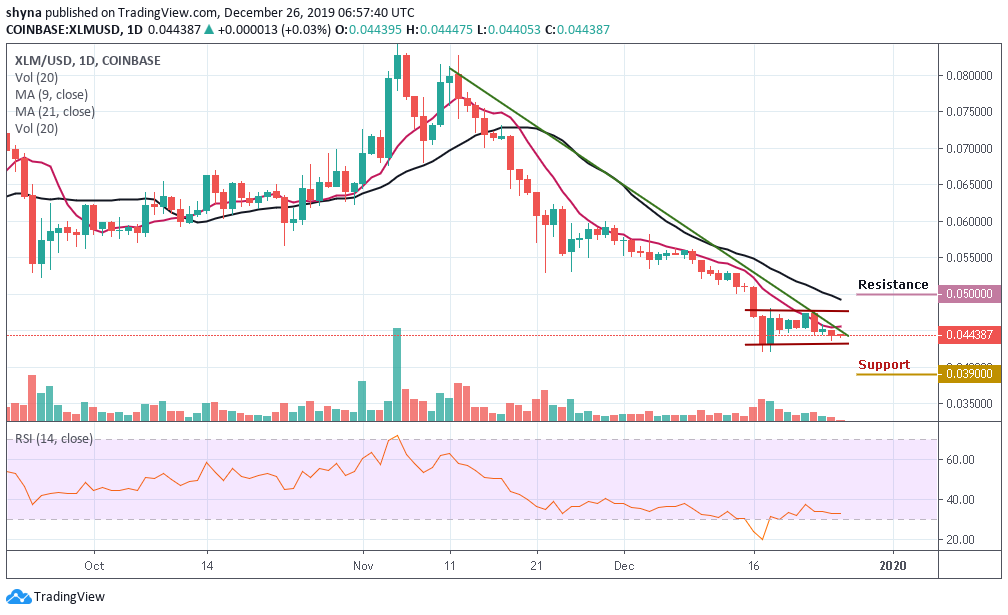
Stellar is yet to make any significant move towards price recovery. The Stellar (XLM) market fell sharply to the crucial support at $0.045 after the price was rejected at around $0.047. Looking at the daily chart, the bears seem to be coming back into the market. Stellar is currently trading below the 9-day and 21-day moving averages, bringing a bear candle formation.
However, the bulls will have to take the price above $0.047 level to build an upside momentum in order to gain traction with the next focus on $0.050, followed by psychological $0.052 and $0.054 levels. On the downside, the initial support may likely come at $0.039, $0.037 and $0.035 respectively. The sideways movement of the RSI (14) indicator shows that XLM has a positive agreement with the trend.
XLM/BTC Market
Against Bitcoin, the pair is still trading on the downside and has eventually broken another solid support at the 620 SAT under the 9-day and 21-day moving averages. Stellar price may likely see another sharp drop at 605 SAT support level if it breaks below the channel. Breaking this level could further drag the market to the nearest support levels at 570 SAT and below.
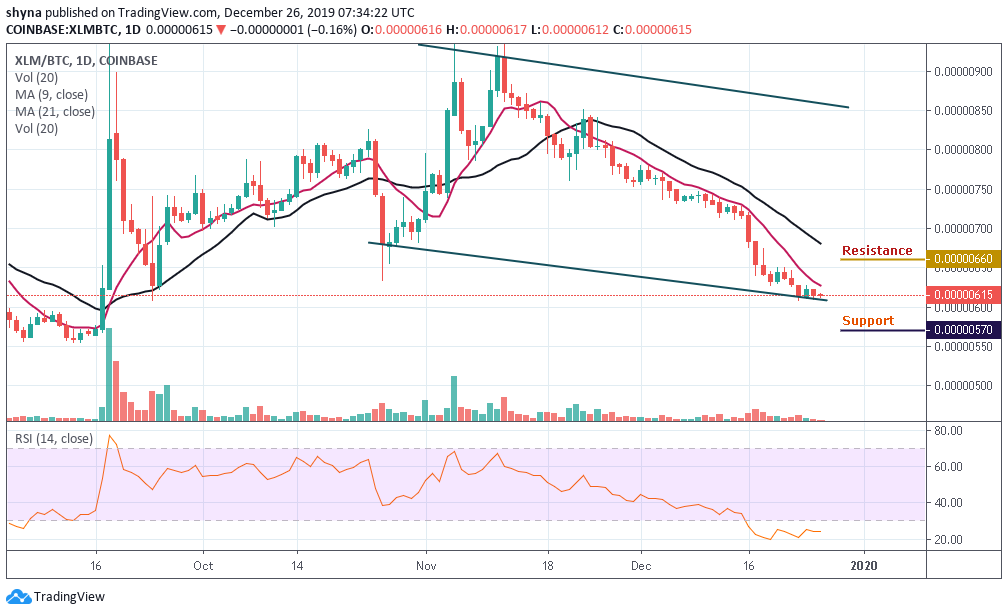
However, Stellar (XLM) is currently hovering at 615 SAT, if the bulls can hold the price and possibly push it up to cross the 9-day moving average, the next key targets resistance lies at 660 SAT and above. Meanwhile, RSI (14) is extremely lying at the oversold zone, indicating that there might be bullish signals if it turns upward.
Please note: Cryptovibes.com is not a financial advisor. Do your research before investing your funds in any financial asset or presented product or event. We are not responsible for your investing results.