
BCH Price Analysis – December 26
Looking at the daily chart, Bitcoin Cash (BCH) rides the bulls. The traders may likely have a great week ahead.
BCH/USD Market
Key Levels:
Resistance levels: $215, $220, $230
Support levels: $160, $150, $140
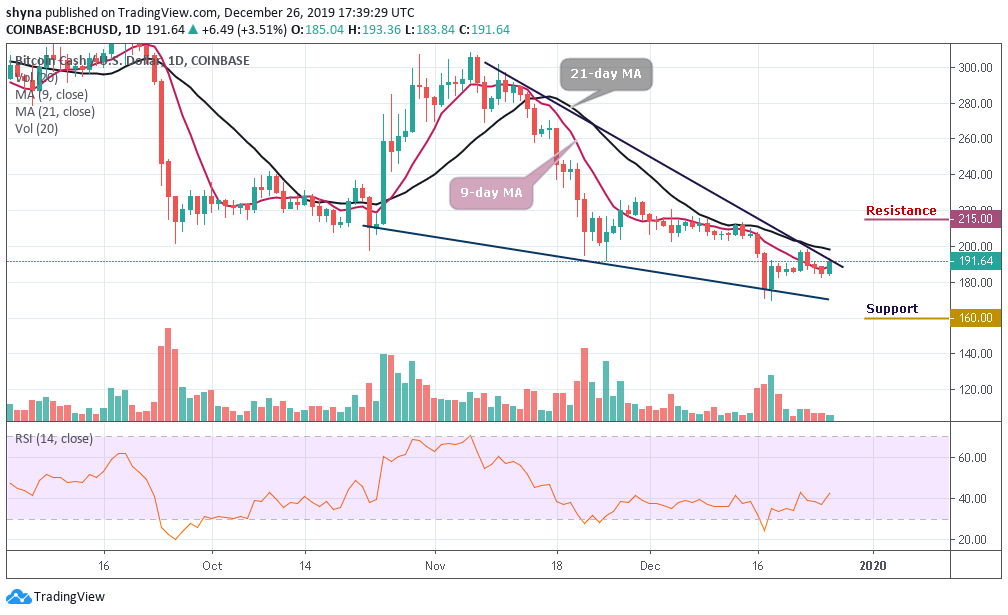
If the BCH trading volume can be increased significantly, a bullish run is likely to occur. Following the recent price, BCH/USD is currently facing a critical resistance at $195 level at the upper boundary of the channel. A break above the ascending channel is likely to produce a huge green candle to the upside, marking resistances at $215, $220, $230 levels. When this is done, the BCH market will follow a bullish run.
However, a bearish step back may likely roll the market back to $180 support with a possible break down to $160, $150 and $140 supports, establishing a new monthly low for the market. Looking at the chart, we can see that the trading volume is rising slowly, giving a sign of an upcoming big move. The RSI (14) hovers above the 40-level due to a little price increase. A precise bull cross might reveal more buy signals for the market.
BCH/BTC Market
At the opening of the market today, the Bitcoin Cash has been making an attempt to rise against Bitcoin but as it appeared, there’s a low amount of buying pressure in the market which is why the price dropped again after touching 0.026 BTC. BCH price has moved above the 9-day MA to where it’s trading currently.
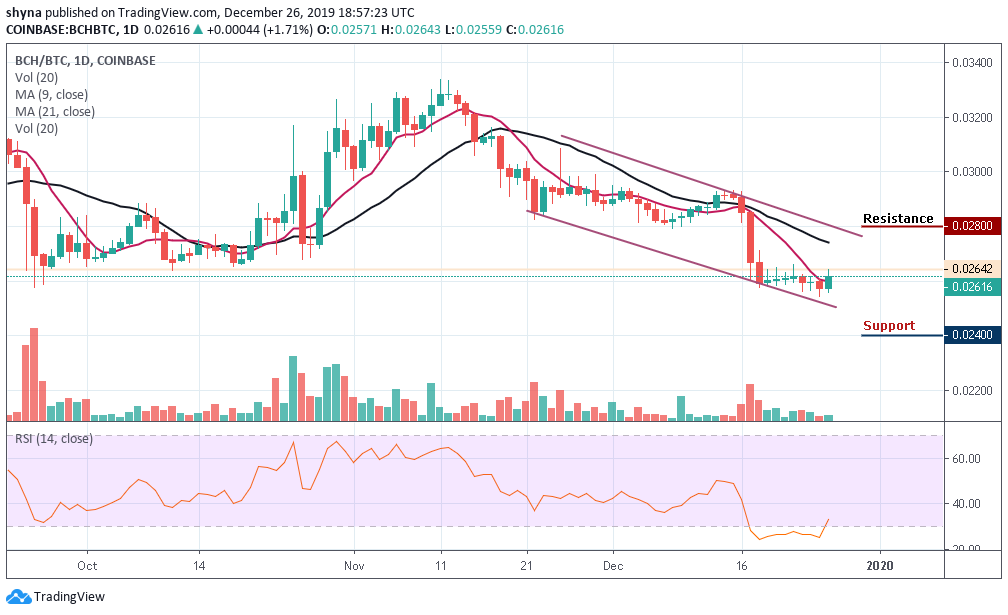
Moreover, if the bears try to break down the price, one would expect the market to fall to the support level of 0.024 BTC and 0.023 BTC. Meanwhile, a bullish continuation may likely push the price to the resistance levels of 0.028 BTC and 0.029 BTC respectively. Once the scenario is done, the market will continue to respect the upward movement.
Please note: Cryptovibes.com is not a financial advisor. Do your research before investing your funds in any financial asset or presented product or event. We are not responsible for your investing results.