
This article was originally published on November 14th, 2019.
The last time we covered the BlackRock Enhanced Equity Dividend Trust (BDJ) was on July 13th, 2019. We have seen quite a remarkable performance since then. The performance can be attributed to the overall broader market doing well, and a discount contraction, in general. The fund was sitting at a 7.32% discount in the prior coverage and has since narrowed to a 4.02% discount. Overall, I would be a bit more hesitant with picking up shares at these levels than I was prior. The discount is still pretty attractive, but the fund being solely in equities does make me pause. The combination of hitting new all-time highs in the broader markets and the sharp discount contraction plays a factor in this. The positive for BDJ is its options strategy that can help performance if we get sideways to a slightly down market for some time.
In fact, I highlighted its options strategy in the prior coverage. Ironically enough, we were at all-time highs then as well. The biggest difference being that the discount was much more attractive at that time.

On July 13th, shares were trading at $8.99, with a NAV of $9.70. Today, they trade at $9.56 on the market, with a NAV of $9.96. This works out to price appreciation of 6.34% for the market price and a NAV appreciation of only 2.68%. While this is favorable as we buy and sell at the market price, the lagging NAV performance by such a large degree has taken a large chunk out of the fund’s previous discount.
I think the long-term viability of this fund is sound, but just warrants a bit of caution at the moment. Similarly, the S&P 500 SPDR ETF (SPY) had appreciated from $300.65 per share to $309. This works out to price appreciation of 2.77%. This calculation also doesn’t include any dividends or distributions that were paid out. However, SPY’s returns and BDJ’s NAV return have been quite similar. If an investor is more active in trading, this may be an opportune time to take some profits off the table and look for a better entry price at a later time. However, there is a lack of alternatives at the moment to turn to whose valuations aren’t similarly highly valued. Staying in cash for long enough periods can also have detrimental effects. An investor would also be giving up BDJ’s 6.28% distribution rate if the alternative was to put the funds in cash.
My alternative would be that if you are looking for a domestic covered call fund and you find BDJ to be a suitable place for yourself, then making small purchases or dollar cost averaging into the name could be rewarded over the long term. BDJ is rated as a “Hold” at the CEF/ETF Income Laboratory. We would ideally be looking to make large purchases at an 8% discount and selling at a 2% premium.
About The Fund
BDJ is a very large fund relative to other CEFs with $1.868 billion in assets. The fund has an investment objective of “current income and current gains.” Its secondary objective is “long-term capital appreciation.” To meet this objective, the fund will invest “substantially all of its total assets in dividend-paying equities.” It does state that the fund may “invest up to 20% of its total assets in equity securities of issuers that do not pay dividends.”
This leaves management with quite a few choices and flexibility. However, the focus on dividend stocks can help us know that the underlying portfolio will have significant exposure to “blue chip” type positions. The fund will also utilize a covered call writing strategy on single positions in the portfolio. Currently, the portfolio is 51.71% overwritten, as of its latest Fact Sheet.
The total expense ratio of the fund is quite low at 0.85%.
Performance
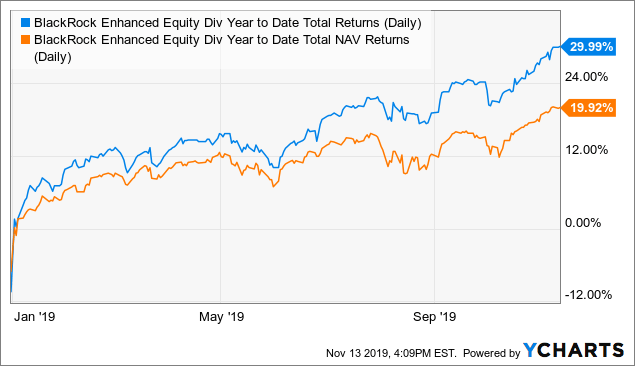
On a YTD basis, the fund is lagging the broader market showing a total return of 19.92%. This can be compared to SPY which has a total return of 25.32%. With the sharply rising market of 2019, off the lows of December 2018, this shouldn’t be all too unexpected. Since the fund utilizes an options strategy on individual holdings in the portfolio, these shares can get called away. It could also buy back the covered call at a higher price than the premium it received. Although SPY isn’t the best benchmark since the fund can invest outside of just large-cap U.S. domestic positions. BlackRock uses the Russell 1000 Value Index as BDJ’s benchmark.
The iShares Russell 1000 Value ETF (IWD), offered by BlackRock as well, is up 21.73% YTD. So, even using its appropriate benchmark shows us underperformance. I would attribute this lag to be primarily due to its covered call options strategy. However, this is still consistent with a market that is shooting higher for 2019.
The current discount of the fund at 4.02% puts BDJ at a higher valuation than its one-year average. The fund’s one-year average comes in at -7.79%, giving the fund a z-score of 1.80. This would indicate that the fund is overvalued by quite a bit. However, I’m less inclined to focus so much on the exact discount, more than a discount at all. The fact is that a lot of CEFs are showing considerably higher valuations. Leaving investors with little alternatives if they have a bit of cash that they don’t want sitting around. In general, I don’t invest as aggressively at all-time highs, but I also focus on growing my cash flow month over month. This makes me make small purchases. In addition to this, I believe we have also seen a discount contraction due to the fund raising its distribution in July. Perhaps the market is valuing BDJ a bit higher for positive action.
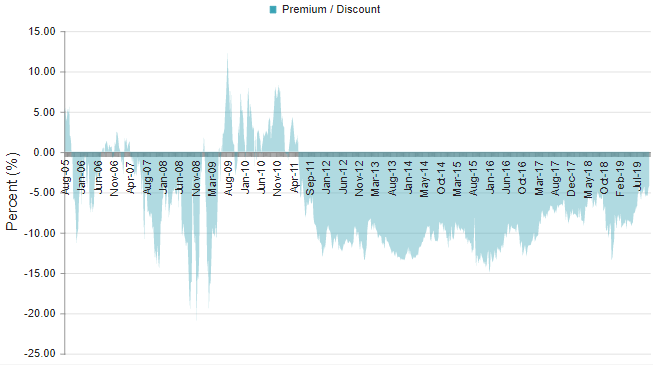
(Source – CEFConnect)
Distribution
The fund currently pays out a monthly distribution of $0.05. This was raised for its July 2019 distribution. Before the raise, the fund was paying out a monthly rate of $0.0467.
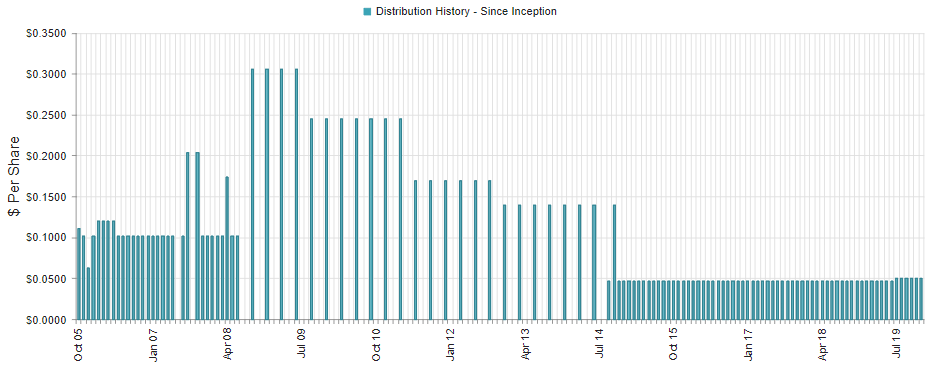
(Source – CEFConnect)
Worthy of note was the large cuts that the fund experienced in the financial collapse of 2008/09. This led to many equity-focused funds having to make the same significant cuts. I don’t believe this is a negative for the fund overall. I am a bit surprised though with how conservative BlackRock is with BDJ. The current distribution rate is 6.28%, with a NAV rate of 6.02%. This is quite a bit lower than other options equity funds. BlackRock does seem to be a bit more conservative with its funds though, in general.
Since we last covered BDJ, it has released its semi-annual report as well, giving us fresh numbers to look at. As one should have expected, the numbers are looking great for the six months ending 6/30/19. They have only got even better since then too.
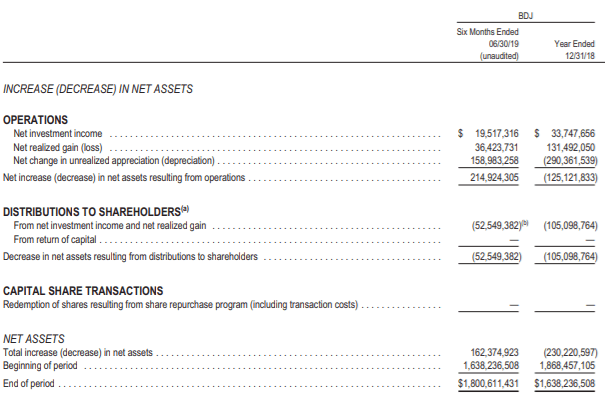
(Source – Semi-Annual Report)
As we can easily compare it with its prior annual report, NII has improved quite significantly. It is important to consider though that with any equity-focused fund, capital gains will be the primary component of the distribution. As such, it is important to monitor the unrealized appreciation of the underlying portfolio.
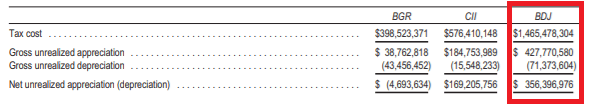
(Source – Semi-Annual Report)
At year-end reporting for 2018, BDJ had $197,418,771 in unrealized appreciation in its portfolio. As anticipated, we have seen a significant jump since that time with the underlying portfolio performing very well.
The increased distribution we received was welcomed. I believe it could have bumped this up even higher. It is perhaps just being cautious as we enter the 11th year of the current bull market though. The distribution level I believe is safe, even if we experience a mild recession.
Holdings
(Source – BDJ Website)
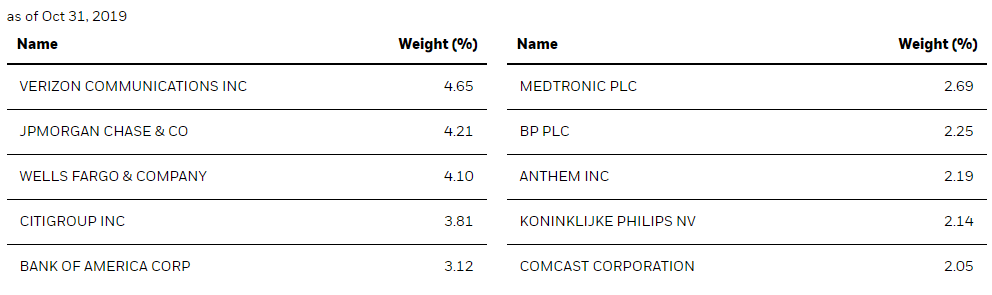
The fund’s top 10 holdings have shifted only a small bit since June 28th, 2019. Removed from the top 10 were Microsoft (MSFT) and Pfizer (PFE). Added to the top 10 were Koninklijke Philips NV (PHG) and Comcast Corporation (CMCSA).
It is probably regretting removing MSFT from the portfolio as the company has been on an incredible run. This doesn’t tell us exactly when it dropped MSFT though. For another reference, it wasn’t included in its September 2019 Fact Sheet either.
PHG is headquartered in Amsterdam, Netherlands. However, it is a large multinational company operating in various healthcare-related devices. CMCSA is a little bit better known than PHG as it operates on a global scale in media and technology.

(Source – BDJ Website)
The largest sector exposure for BDJ by far is the financial sector. Initially, the market was suggesting that financial sector would perform very poorly, as the Fed has been making its “insurance cuts” to interest rates. However, we have since seen these large financial giants report great earnings just a few weeks ago. They have also been lifted with the optimism surrounding the “phase one” trade deal. I’m personally a bit more cautious about the successful outcome of this trade deal. I won’t believe we truly have a resolution until both sides sign a deal and follow through on the said deal. That is yet to be seen, and there is no set time for when this could happen.
JPMorgan Chase (JPM) reported a large beat on its Q3 EPS and revenue. Wells Fargo (WFC) missed on EPS, but beat on revenue. Citigroup (C) beat on EPS and revenue as well. These three holdings are within BDJ’s top 5. They made up about 12% of the portfolio, as well as Bank of America (BAC), which brings those four names to 15% of the portfolio. That alone can leave BDJ vulnerable to the downside should we see a slowdown. The Fed cutting rates though haven’t appeared to hurt the banks yet. I did point this out in the prior coverage that the Fed cutting would have a negative impact on banks. Perhaps, they are positioning themselves to not be so reliant on interest rates. As “lower for longer” has become the new mantra, this would appear to be positive. I would like to see Q4 earnings when all the cuts have been in place and we can get a better overall picture.
These are also “blue chip” type large-cap banks that probably aren’t going anywhere anytime soon. So, if we do see an impact, it would likely impact smaller financials first. Additionally, I believe that the financial sector is paramount in constructing an overall diversified portfolio for the long-term. BDJ helps give us that at the moment.
Conclusion
BDJ has done quite well since we last covered the fund in July. The fund went through a period of volatility, as did the rest of the market, in August. However, we are now at new all-time highs, and the discount has contracted on BDJ. I am a bit more cautious about adding significant capital at these levels compared to where I was before, even in a solid fund.
The last time we covered shares of BDJ, we were also at all-time highs on the market. So, I will leave this on a similar note – BDJ is willing to give us a 6.28% distribution while we wait for a better opportunity!
Profitable CEF and ETF income and arbitrage ideas
 At the CEF/ETF Income Laboratory, we manage ~8%-yielding closed-end fund (CEF) and exchange-traded fund (ETF) portfolios to make income investing easy for you. Check out what our members have to say about our service.
To see all that our exclusive membership has to offer, sign up for a free trial by clicking on the button below!

Disclosure: I am/we are long BDJ, JPM, MSFT. I wrote this article myself, and it expresses my own opinions. I am not receiving compensation for it (other than from Seeking Alpha). I have no business relationship with any company whose stock is mentioned in this article.
